Summary Table (Download Table)
| Co-regulatory TF | Tissue | -log(P) |
  | | |
| NF-E2 | bone | 7.26027 |
| E2F-1 | bone_marrow | 6.58996 |
| PEA3 | bone_marrow | 6.58852 |
| CDP | brain | 6.35253 |
| E47 | brain | 8.64753 |
| ER | brain | 6.51427 |
| FOXJ2 | brain | 9.24697 |
| GATA-1 | brain | 6.86692 |
| GCM | brain | 6.83258 |
| HIF-1 | brain | 7.77983 |
| MEIS1 | brain | 7.50553 |
| OCT-1 | brain | 7.57459 |
| RREB-1 | brain | 9.60531 |
| SMAD-3 | brain | 10.5392 |
| CHX10 | eye | 9.21553 |
| PITX2 | eye | 6.64646 |
| ALPHA-CP1 | heart | 11.5243 |
| AMEF-2 | heart | 11.3966 |
| AP-1 | heart | 17.5307 |
| AP-2REP | heart | 8.34428 |
| AP-4 | heart | 16.3926 |
| ARNT | heart | 6.67369 |
| BACH1 | heart | 11.8862 |
| BRN-2 | heart | 8.99714 |
| BSAP | heart | 20.468 |
| C-ETS-1 | heart | 6.38457 |
| C-MYC/MAX | heart | 8.54911 |
| C/EBP | heart | 6.99639 |
| COUP-TF/HNF-4 | heart | 8.83337 |
| E2F | heart | 9.15755 |
| GATA-1 | heart | 8.57008 |
| GATA-2 | heart | 10.1418 |
| GATA-6 | heart | 7.66116 |
| GATA-X | heart | 13.1628 |
| HEB | heart | 12.6273 |
| HNF-1 | heart | 7.83853 |
| HNF-3ALPHA | heart | 10.0079 |
| IPF1 | heart | 6.43286 |
| LBP-1 | heart | 6.4409 |
| MAZ | heart | 25.8573 |
| MAZR | heart | 16.9494 |
| MEF-2 | heart | 21.8976 |
| MEIS1 | heart | 14.0465 |
| MTF-1 | heart | 8.02008 |
| MYOD | heart | 11.9358 |
| MZF1 | heart | 11.2354 |
| NF-E2 | heart | 18.9785 |
| NF-KAPPAB_(P50) | heart | 8.87017 |
| NF-KAPPAB_(P65) | heart | 7.92895 |
| NRSF | heart | 12.0065 |
| PITX2 | heart | 6.90899 |
| POU1F1 | heart | 11.1706 |
| PPARALPHA/RXR-ALPHA | heart | 10.1479 |
| PU.1 | heart | 13.6439 |
| RREB-1 | heart | 13.2095 |
| RSRFC4 | heart | 21.1323 |
| SF-1 | heart | 10.3035 |
| SMAD-4 | heart | 9.24643 |
| SP3 | heart | 21.0334 |
| SREBP-1 | heart | 8.96862 |
| SRF | heart | 35.9479 |
| STAT3 | heart | 9.07857 |
| STAT6 | heart | 7.905 |
| TAL-1BETA/E47 | heart | 6.30843 |
| TGIF | heart | 13.3632 |
| TITF1 | heart | 9.55532 |
| TST-1 | heart | 11.8639 |
| USF | heart | 8.09961 |
| YY1 | heart | 7.40664 |
| ZID | heart | 8.71671 |
| CRX | kidney | 6.3439 |
| FOXO1 | kidney | 9.57066 |
| FOXO3 | kidney | 6.71829 |
| FREAC-2 | kidney | 7.46519 |
| HNF-1 | kidney | 8.68023 |
| HNF-4ALPHA | kidney | 16.4428 |
| HSF | kidney | 6.64636 |
| NKX2-2 | kidney | 6.96699 |
| OCT-1 | kidney | 11.3792 |
| STAT4 | kidney | 8.61199 |
| STAT5A | kidney | 7.39758 |
| AP-2GAMMA | larynx | 6.88943 |
| AP-4 | larynx | 8.24415 |
| BRN-2 | larynx | 7.96699 |
| BSAP | larynx | 7.46686 |
| C/EBP | larynx | 8.21626 |
| CHX10 | larynx | 7.12042 |
| E2F | larynx | 7.46849 |
| E2F-1 | larynx | 11.9738 |
| ERR_ALPHA | larynx | 8.14905 |
| ETF | larynx | 7.07465 |
| FXR | larynx | 10.8134 |
| GR | larynx | 6.4367 |
| LUN-1 | larynx | 10.4544 |
| MEF-2 | larynx | 7.44835 |
| MIF-1 | larynx | 10.4312 |
| NF-1 | larynx | 7.67747 |
| NF-KAPPAB | larynx | 8.9813 |
| NF-KAPPAB_(P50) | larynx | 8.62997 |
| NF-KAPPAB_(P65) | larynx | 9.8345 |
| NKX2-2 | larynx | 6.28901 |
| P53 | larynx | 7.15712 |
| SF-1 | larynx | 9.55138 |
| SMAD-4 | larynx | 10.3608 |
| SRF | larynx | 17.3659 |
| TATA | larynx | 11.6752 |
| HNF-3ALPHA | liver | 6.52607 |
| MTF-1 | lung | 7.1327 |
| STAT6 | lung | 6.77474 |
| AMEF-2 | muscle | 18.1996 |
| AP-1 | muscle | 8.00094 |
| ARP-1 | muscle | 11.3155 |
| BACH1 | muscle | 10.68 |
| BRN-2 | muscle | 6.22437 |
| C-MYC/MAX | muscle | 10.3504 |
| CDC5 | muscle | 6.66624 |
| CDP_CR3 | muscle | 6.26818 |
| CDP_CR3+HD | muscle | 7.64551 |
| COUP-TF/HNF-4 | muscle | 11.1122 |
| E47 | muscle | 13.4507 |
| ER | muscle | 7.13334 |
| FOXD3 | muscle | 7.7301 |
| GATA-3 | muscle | 7.67081 |
| HNF-4ALPHA | muscle | 6.82433 |
| HSF1 | muscle | 7.04085 |
| IRF1 | muscle | 6.19996 |
| LMO2_COMPLEX | muscle | 6.23754 |
| LUN-1 | muscle | 9.43907 |
| MAZR | muscle | 10.285 |
| MEF-2 | muscle | 30.8206 |
| MIF-1 | muscle | 12.3709 |
| MRF-2 | muscle | 8.77958 |
| NERF1A | muscle | 6.47593 |
| NF-KAPPAB | muscle | 8.45874 |
| NF-KAPPAB_(P50) | muscle | 8.13258 |
| NR2E3 | muscle | 10.5245 |
| PITX2 | muscle | 7.54654 |
| PU.1 | muscle | 6.87366 |
| RREB-1 | muscle | 14.6692 |
| RSRFC4 | muscle | 23.7435 |
| SMAD-3 | muscle | 10.0989 |
| SREBP-1 | muscle | 7.2686 |
| SRF | muscle | 12.9346 |
| TAL-1BETA/ITF-2 | muscle | 7.2139 |
| TATA | muscle | 29.8598 |
| TAX/CREB | muscle | 9.45992 |
| TEF | muscle | 7.8435 |
| TEF-1 | muscle | 12.4996 |
| TST-1 | muscle | 15.3313 |
| USF | muscle | 6.83697 |
| ZID | muscle | 10.8825 |
| FAC1 | pancreas | 7.4837 |
| FOXJ2 | pancreas | 7.32637 |
| GR | pancreas | 6.27337 |
| OCT-1 | pancreas | 8.73558 |
| POU3F2 | pancreas | 6.59327 |
| BACH2 | peripheral_nervous_system | 7.56494 |
| C/EBPBETA | peripheral_nervous_system | 6.45924 |
| CREB | peripheral_nervous_system | 8.66 |
| FREAC-2 | peripheral_nervous_system | 6.78121 |
| IPF1 | peripheral_nervous_system | 9.49702 |
| IRF-7 | peripheral_nervous_system | 7.4338 |
| MAZR | peripheral_nervous_system | 9.3056 |
| MEF-2 | peripheral_nervous_system | 9.96629 |
| NRL | peripheral_nervous_system | 6.41224 |
| PAX-3 | peripheral_nervous_system | 6.96095 |
| RSRFC4 | peripheral_nervous_system | 14.8561 |
| SP1 | peripheral_nervous_system | 8.22054 |
| AP-4 | prostate | 6.96416 |
| C/EBPALPHA | prostate | 7.94899 |
| FREAC-4 | prostate | 8.75453 |
| HEB | prostate | 8.45194 |
| OCT-1 | prostate | 7.23276 |
| TFII-I | prostate | 6.69261 |
| TFIIA | prostate | 6.54199 |
| HNF-1 | skin | 6.271 |
| PBX-1 | skin | 6.19359 |
| AP-1 | small_intestine | 6.29627 |
| AP-2 | small_intestine | 6.31309 |
| E2F | small_intestine | 18.79 |
| E2F-4/DP-1 | small_intestine | 10.7557 |
| ELF-1 | small_intestine | 7.4698 |
| ELK-1 | small_intestine | 11.6704 |
| GATA-4 | small_intestine | 6.2396 |
| GCNF | small_intestine | 7.73213 |
| HMG_IY | small_intestine | 8.05183 |
| HNF-1 | small_intestine | 10.5223 |
| LHX3 | small_intestine | 6.34799 |
| LUN-1 | small_intestine | 10.0542 |
| NF-AT | small_intestine | 8.60894 |
| NKX6-2 | small_intestine | 6.21712 |
| PEA3 | small_intestine | 7.74605 |
| RB/E2F-1/DP-1 | small_intestine | 11.9255 |
| TITF1 | small_intestine | 6.36596 |
| USF | small_intestine | 9.35976 |
| WHN | small_intestine | 7.28531 |
| ZID | small_intestine | 7.20726 |
| CREB | soft_tissue | 10.0546 |
| EGR-1 | soft_tissue | 8.62388 |
| GATA-4 | soft_tissue | 9.71006 |
| LUN-1 | soft_tissue | 6.61047 |
| MAZR | soft_tissue | 10.264 |
| MEF-2 | soft_tissue | 9.66168 |
| NF-KAPPAB_(P65) | soft_tissue | 6.93176 |
| PAX-3 | soft_tissue | 6.42872 |
| RSRFC4 | soft_tissue | 9.16871 |
| SP1 | soft_tissue | 16.9948 |
| TAX/CREB | soft_tissue | 7.18248 |
| TBP | soft_tissue | 6.19841 |
| TFIIA | soft_tissue | 6.79976 |
| CART-1 | stomach | 6.21877 |
| GCNF | stomach | 7.67224 |
| LHX3 | stomach | 7.23197 |
| CDP_CR3+HD | testis | 7.30741 |
| POU3F2 | uterus | 7.67881 |
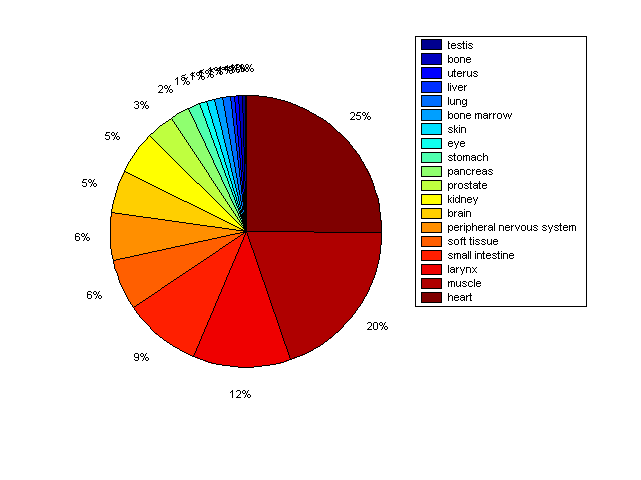
Distribution of Co-regulatory TFs
|
|
|
Description: this pie chart displays the distribution of co-regulatory transcription factors (TFs) in different tissues. Color schema: the tissue with the largest percentage of co-regulatory TFs is colored dark red whereas the tissue with the smallest percentage of co-regulatory TFs is colored dark blue. Tissues with intermediate percentages of co-regulatory TFs are colored from light red to yellow and cyan and then to light blue. |