Summary Table (Download Table)
| Co-regulatory TF | Tissue | -log(P) |
  | | |
| SREBP-1 | muscle | 10.3749 |
| GR | muscle | 10.1102 |
| OCT-1 | peripheral_nervous_system | 9.89995 |
| C/EBP | eye | 9.6354 |
| HAND1/E47 | eye | 9.27905 |
| IPF1 | lymph_node | 8.05179 |
| C-MYC/MAX | muscle | 7.99893 |
| CDP | muscle | 7.96982 |
| CRX | kidney | 7.86992 |
| TATA | heart | 7.86086 |
| IPF1 | stomach | 7.35071 |
| POU3F2 | peripheral_nervous_system | 7.33483 |
| STAT5A_(HOMOTETRAMER) | soft_tissue | 7.23239 |
| C-ETS-2 | muscle | 7.11885 |
| SRF | muscle | 7.04085 |
| ARNT | muscle | 6.94516 |
| GATA-4 | small_intestine | 6.91175 |
| NF-Y | peripheral_nervous_system | 6.83106 |
| AP-1 | bladder | 6.50787 |
| USF | muscle | 6.4913 |
| PPARALPHA/RXR-ALPHA | muscle | 6.43599 |
| LEF-1 | brain | 6.38221 |
| TST-1 | brain | 6.33171 |
| NF-Y | soft_tissue | 6.26662 |
| RREB-1 | soft_tissue | 6.24613 |
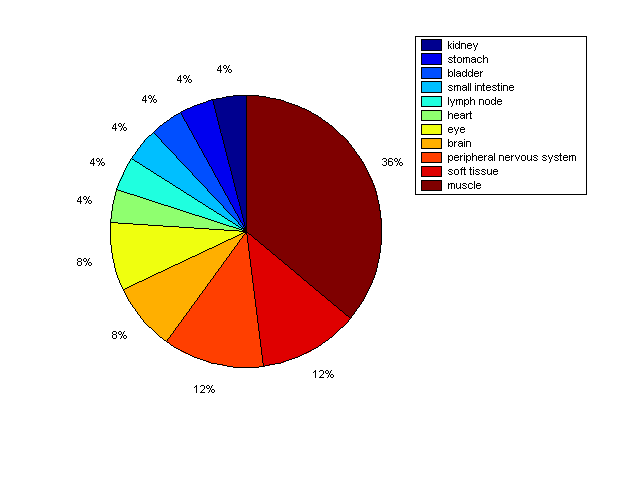
Distribution of Co-regulatory TFs
|
|
|
Description: this pie chart displays the distribution of co-regulatory transcription factors (TFs) in different tissues. Color schema: the tissue with the largest percentage of co-regulatory TFs is colored dark red whereas the tissue with the smallest percentage of co-regulatory TFs is colored dark blue. Tissues with intermediate percentages of co-regulatory TFs are colored from light red to yellow and cyan and then to light blue. |