Summary Table (Download Table)
| Co-regulatory TF | Tissue | -log(P) |
  | | |
| MAZ | small_intestine | 13.3463 |
| LF-A1 | peripheral_nervous_system | 12.0598 |
| C-MYC/MAX | small_intestine | 11.1138 |
| TATA | muscle | 10.3793 |
| ER | placenta | 10.3486 |
| NF-KAPPAB_(P65) | small_intestine | 9.72361 |
| MAZR | small_intestine | 9.03513 |
| NF-KAPPAB | small_intestine | 9.00631 |
| TCF11 | larynx | 8.80302 |
| OCT-1 | tongue | 8.75951 |
| ETF | larynx | 8.72563 |
| LBP-1 | muscle | 8.58482 |
| ZID | larynx | 8.4873 |
| AP-2GAMMA | tongue | 8.28205 |
| RSRFC4 | muscle | 8.27491 |
| OCT-X | tongue | 7.95406 |
| P53 | larynx | 7.86734 |
| AP-2GAMMA | larynx | 7.76791 |
| MEF-2 | uterus | 7.55177 |
| E4BP4 | lung | 7.35899 |
| HAND1/E47 | stomach | 7.35467 |
| HEB | larynx | 7.27793 |
| AP-2ALPHA | larynx | 7.25845 |
| ETF | mammary_gland | 7.21477 |
| TAL-1BETA/ITF-2 | muscle | 7.19204 |
| SRF | larynx | 7.15712 |
| PPARG | larynx | 7.13983 |
| NF-MUE1 | larynx | 7.11804 |
| E2F | brain | 7.05188 |
| SMAD-4 | larynx | 7.01157 |
| LBP-1 | small_intestine | 6.95362 |
| P53 | tongue | 6.8886 |
| PPARALPHA/RXR-ALPHA | blood | 6.78903 |
| TAL-1ALPHA/E47 | tongue | 6.73129 |
| AP-4 | muscle | 6.61636 |
| PAX-1 | larynx | 6.56345 |
| RSRFC4 | uterus | 6.49456 |
| RORALPHA1 | muscle | 6.48108 |
| AREB6 | small_intestine | 6.47927 |
| OCT-1 | uterus | 6.4651 |
| TAL-1BETA/ITF-2 | larynx | 6.45738 |
| SREBP-1 | bladder | 6.41653 |
| MEF-2 | muscle | 6.39995 |
| PEA3 | larynx | 6.38592 |
| TAL-1ALPHA/E47 | larynx | 6.32016 |
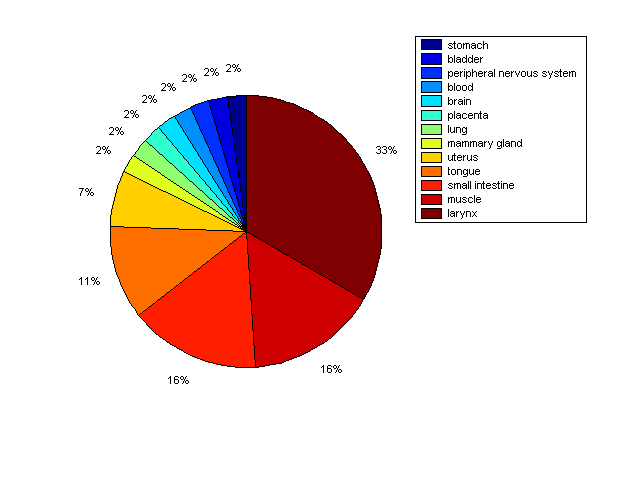
Distribution of Co-regulatory TFs
|
|
|
Description: this pie chart displays the distribution of co-regulatory transcription factors (TFs) in different tissues. Color schema: the tissue with the largest percentage of co-regulatory TFs is colored dark red whereas the tissue with the smallest percentage of co-regulatory TFs is colored dark blue. Tissues with intermediate percentages of co-regulatory TFs are colored from light red to yellow and cyan and then to light blue. |