Summary Table (Download Table)
| Co-regulatory TF | Tissue | -log(P) |
  | | |
| MEF-2 | muscle | 23.5485 |
| CRX | eye | 19.1884 |
| GATA-1 | heart | 16.97 |
| LHX3 | peripheral_nervous_system | 13.6379 |
| GATA-6 | heart | 12.7912 |
| C/EBP | muscle | 11.6761 |
| NKX6-1 | heart | 11.4494 |
| STAT4 | heart | 11.0703 |
| AP-1 | heart | 10.7507 |
| NKX3A | peripheral_nervous_system | 10.4782 |
| TGIF | muscle | 9.66399 |
| MEIS1 | heart | 9.5493 |
| PPARG | skin | 9.32037 |
| FXR | eye | 8.9686 |
| STAT5A | eye | 8.86426 |
| MYOD | eye | 8.58718 |
| GATA-X | heart | 8.55411 |
| TCF11/MAFG | heart | 8.17463 |
| TAL-1BETA/E47 | eye | 8.12741 |
| POU3F2 | peripheral_nervous_system | 8.07753 |
| TCF11 | soft_tissue | 8.01991 |
| LHX3 | kidney | 7.9856 |
| FOXJ2 | kidney | 7.9513 |
| CART-1 | peripheral_nervous_system | 7.68463 |
| HNF-1 | heart | 7.64104 |
| FAC1 | lymph_node | 7.61051 |
| FAC1 | skin | 7.55603 |
| TAL-1BETA/ITF-2 | muscle | 7.55082 |
| SRF | muscle | 7.54654 |
| TAL-1ALPHA/E47 | muscle | 7.52894 |
| CDP_CR3+HD | muscle | 7.52355 |
| TEF | muscle | 7.40435 |
| CACCC-BINDING_FACTOR | ovary | 7.30054 |
| NF-Y | eye | 7.27981 |
| RP58 | muscle | 7.26919 |
| TCF11 | peripheral_nervous_system | 7.04263 |
| C/EBP | bone | 6.97137 |
| SRF | heart | 6.90899 |
| GCNF | muscle | 6.86041 |
| TAL-1BETA/ITF-2 | heart | 6.78146 |
| DBP | soft_tissue | 6.77801 |
| TCF11 | muscle | 6.77279 |
| NKX6-2 | peripheral_nervous_system | 6.73082 |
| SRF | eye | 6.64646 |
| AP-1 | muscle | 6.56346 |
| PBX-1 | muscle | 6.55288 |
| AREB6 | muscle | 6.50618 |
| EF-C | brain | 6.46789 |
| HNF-4 | brain | 6.45529 |
| STAT5A | skin | 6.43766 |
| FOXO4 | kidney | 6.41365 |
| HOXA4 | soft_tissue | 6.3956 |
| IPF1 | peripheral_nervous_system | 6.37989 |
| ATF | eye | 6.25194 |
| TAL-1BETA/E47 | muscle | 6.24954 |
| SMAD-3 | skin | 6.20838 |
| MEIS1 | skin | 6.20041 |
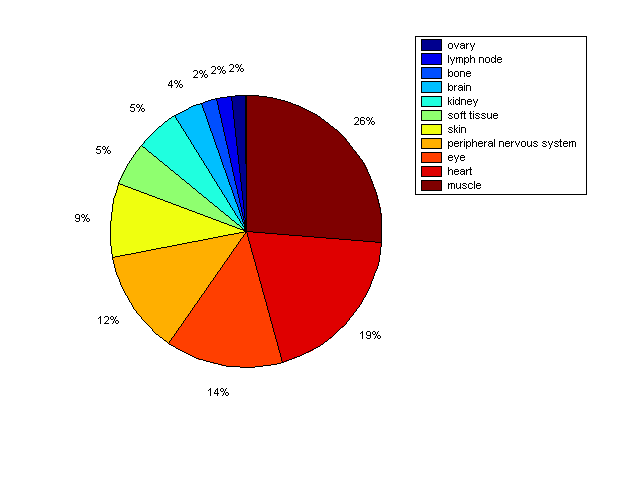
Distribution of Co-regulatory TFs
|
|
|
Description: this pie chart displays the distribution of co-regulatory transcription factors (TFs) in different tissues. Color schema: the tissue with the largest percentage of co-regulatory TFs is colored dark red whereas the tissue with the smallest percentage of co-regulatory TFs is colored dark blue. Tissues with intermediate percentages of co-regulatory TFs are colored from light red to yellow and cyan and then to light blue. |