Summary Table (Download Table)
| Co-regulatory TF | Tissue | -log(P) |
  | | |
| HNF-1 | colon | 16.0294 |
| NERF1A | brain | 9.76223 |
| HNF-1 | liver | 9.47267 |
| CREB | peripheral_nervous_system | 9.42443 |
| NF-KAPPAB_(P65) | spleen | 9.1844 |
| E2F | brain | 8.80768 |
| HSF2 | eye | 8.55851 |
| SRF | heart | 8.34428 |
| TEF | brain | 8.30909 |
| NF-1 | peripheral_nervous_system | 8.24243 |
| GCNF | colon | 8.06982 |
| FOXO3 | brain | 7.45461 |
| TFII-I | brain | 7.38397 |
| CHOP-C/EBPALPHA | small_intestine | 6.9473 |
| CRE-BP1/C-JUN | peripheral_nervous_system | 6.87701 |
| ALX-4 | colon | 6.77307 |
| TAL-1BETA/E47 | muscle | 6.63417 |
| YY1 | brain | 6.51008 |
| TAL-1ALPHA/E47 | muscle | 6.43238 |
| ATF3 | peripheral_nervous_system | 6.43185 |
| AREB6 | kidney | 6.29595 |
| MYOD | peripheral_nervous_system | 6.24398 |
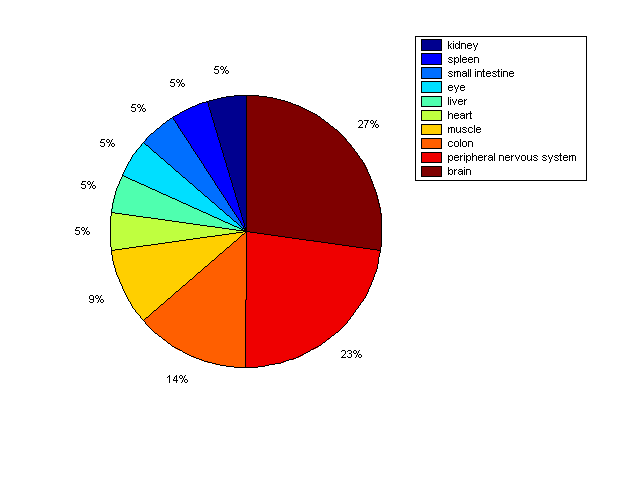
Distribution of Co-regulatory TFs
|
|
|
Description: this pie chart displays the distribution of co-regulatory transcription factors (TFs) in different tissues. Color schema: the tissue with the largest percentage of co-regulatory TFs is colored dark red whereas the tissue with the smallest percentage of co-regulatory TFs is colored dark blue. Tissues with intermediate percentages of co-regulatory TFs are colored from light red to yellow and cyan and then to light blue. |