Summary Table (Download Table)
| Co-regulatory TF | Tissue | -log(P) |
  | | |
| HNF-1 | liver | 14.2095 |
| TATA | heart | 13.3012 |
| MEF-2 | heart | 13.2436 |
| GR | muscle | 12.7263 |
| AR | muscle | 11.7516 |
| BACH2 | larynx | 11.3142 |
| LHX3 | small_intestine | 10.8996 |
| AP-1 | larynx | 10.8693 |
| C/EBPDELTA | liver | 10.8133 |
| POU3F2 | heart | 10.3069 |
| SMAD-4 | brain | 10.2943 |
| HSF1 | muscle | 10.1102 |
| GATA-1 | thymus | 10.0618 |
| TGIF | muscle | 10.0425 |
| MIF-1 | bone | 9.98246 |
| NKX3A | small_intestine | 9.81408 |
| GR | larynx | 9.81275 |
| MEF-2 | muscle | 9.5814 |
| TEF | muscle | 9.49599 |
| HLF | bone_marrow | 9.36982 |
| E2F-1 | soft_tissue | 8.81291 |
| STAT5B_(HOMODIMER) | liver | 8.78504 |
| AR | larynx | 8.77233 |
| RREB-1 | muscle | 8.61282 |
| ZID | muscle | 8.58552 |
| TBP | small_intestine | 8.4363 |
| NF-KAPPAB | soft_tissue | 8.27374 |
| EF-C | bone | 8.23807 |
| E47 | muscle | 8.23348 |
| FOXJ2 | heart | 8.15855 |
| E2F-4/DP-1 | soft_tissue | 7.99611 |
| POU3F2 | small_intestine | 7.94582 |
| E2F | soft_tissue | 7.93577 |
| IRF1 | heart | 7.87154 |
| GCM | larynx | 7.86643 |
| C/EBPBETA | bone_marrow | 7.86221 |
| SREBP-1 | brain | 7.78734 |
| NKX6-2 | small_intestine | 7.69512 |
| CHOP-C/EBPALPHA | brain | 7.63685 |
| E2F-1 | thymus | 7.5606 |
| TGIF | heart | 7.42096 |
| TAL-1BETA/ITF-2 | muscle | 7.38513 |
| C/EBPALPHA | bone_marrow | 7.37841 |
| GATA-X | thymus | 7.37129 |
| MEIS1 | muscle | 7.36369 |
| AREB6 | muscle | 7.30457 |
| SOX-9 | heart | 7.28343 |
| FOXO1 | liver | 7.24655 |
| GATA-X | heart | 7.20706 |
| SP1 | testis | 7.17291 |
| STAT6 | larynx | 7.08579 |
| ZID | larynx | 7.02407 |
| OCT-1 | heart | 7.0022 |
| RB/E2F-1/DP-1 | soft_tissue | 6.95091 |
| CDP | muscle | 6.88856 |
| PPARG | brain | 6.88011 |
| AREB6 | skin | 6.87932 |
| GATA-X | bone_marrow | 6.86254 |
| POU1F1 | liver | 6.84486 |
| C-REL | soft_tissue | 6.8263 |
| C/EBP | bone_marrow | 6.8191 |
| HNF-4 | liver | 6.79447 |
| FREAC-4 | brain | 6.71968 |
| E2F-4/DP-1 | thymus | 6.69685 |
| TAL-1ALPHA/E47 | muscle | 6.57583 |
| PAX-2 | larynx | 6.56475 |
| ZID | small_intestine | 6.49999 |
| HNF-1 | kidney | 6.45643 |
| SRF | larynx | 6.4367 |
| FOXJ2 | bone_marrow | 6.36814 |
| CREB | peripheral_nervous_system | 6.3664 |
| EGR-2 | brain | 6.35045 |
| FOXJ2 | bone | 6.30902 |
| GATA-6 | thymus | 6.30329 |
| COUP-TF/HNF-4 | liver | 6.28771 |
| RSRFC4 | small_intestine | 6.28304 |
| SRF | pancreas | 6.27337 |
| RFX1 | bone | 6.27167 |
| GATA-1 | bone_marrow | 6.27063 |
| ISRE | larynx | 6.21114 |
| E2F | bone | 6.19512 |
| HNF-1 | spleen | 6.19381 |
| C-ETS-2 | lymph_node | 6.17878 |
| E2F | thymus | 6.17765 |
| FREAC-3 | bone | 6.16857 |
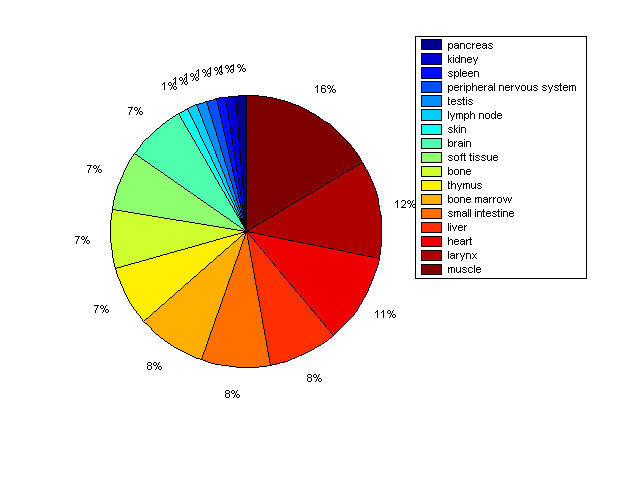
Distribution of Co-regulatory TFs
|
|
|
Description: this pie chart displays the distribution of co-regulatory transcription factors (TFs) in different tissues. Color schema: the tissue with the largest percentage of co-regulatory TFs is colored dark red whereas the tissue with the smallest percentage of co-regulatory TFs is colored dark blue. Tissues with intermediate percentages of co-regulatory TFs are colored from light red to yellow and cyan and then to light blue. |