Summary Table (Download Table)
| Co-regulatory TF | Tissue | -log(P) |
  | | |
| AP-1 | larynx | 29.7612 |
| BACH1 | larynx | 21.5216 |
| SRF | heart | 18.9785 |
| NF-E2 | larynx | 17.6689 |
| TCF11/MAFG | larynx | 15.2464 |
| AP-1 | eye | 14.3266 |
| NF-E2 | eye | 13.418 |
| AP-1 | lymph_node | 12.4413 |
| TAL-1BETA/ITF-2 | muscle | 12.1581 |
| LF-A1 | bone | 11.8923 |
| MEF-2 | muscle | 10.2736 |
| SF-1 | muscle | 9.41576 |
| FREAC-4 | eye | 9.34565 |
| MEIS1 | muscle | 9.21667 |
| MEF-2 | larynx | 9.17748 |
| BACH1 | lymph_node | 9.0992 |
| HNF-1 | kidney | 8.8729 |
| NF-KAPPAB_(P65) | bone | 8.84009 |
| CHX10 | brain | 8.7449 |
| AREB6 | stomach | 8.72517 |
| EF-C | eye | 8.69391 |
| WHN | small_intestine | 8.56523 |
| ELF-1 | blood | 8.45816 |
| STAT3 | larynx | 8.41891 |
| HNF-1 | colon | 8.36342 |
| HEB | eye | 8.3157 |
| TAL-1BETA/E47 | muscle | 8.1699 |
| TAL-1ALPHA/E47 | muscle | 8.10699 |
| ELF-1 | tongue | 8.07332 |
| AP-1 | tongue | 8.04093 |
| AP-1 | bone | 8.01267 |
| AREB6 | eye | 7.9449 |
| TST-1 | heart | 7.93397 |
| PU.1 | eye | 7.90304 |
| NF-E2 | lymph_node | 7.8309 |
| CACCC-BINDING_FACTOR | bone | 7.81193 |
| TCF11/MAFG | lymph_node | 7.75909 |
| NRL | skin | 7.7162 |
| TATA | liver | 7.59416 |
| HNF-1 | small_intestine | 7.58915 |
| BACH2 | tongue | 7.44351 |
| MEF-2 | heart | 7.36469 |
| ATF | bone | 7.34577 |
| BACH2 | bone | 7.34226 |
| E2F | bone | 7.27355 |
| SRF | bone | 7.26027 |
| LUN-1 | bone | 7.13012 |
| NRL | eye | 7.11116 |
| TATA | eye | 6.97633 |
| RREB-1 | eye | 6.90142 |
| MAZ | muscle | 6.8693 |
| NF-Y | blood | 6.8576 |
| BACH1 | eye | 6.84425 |
| OCT-1 | eye | 6.81169 |
| RORALPHA1 | muscle | 6.77711 |
| FOXO4 | small_intestine | 6.75947 |
| TAX/CREB | tongue | 6.72328 |
| FOXJ2 | heart | 6.7114 |
| SRY | prostate | 6.6268 |
| AP-1 | prostate | 6.61917 |
| TCF-4 | bladder | 6.52971 |
| EF-C | bone | 6.4601 |
| FREAC-3 | small_intestine | 6.43354 |
| NR2E3 | muscle | 6.42214 |
| PPARG | larynx | 6.41154 |
| C-ETS-2 | eye | 6.37615 |
| HFH-3 | peripheral_nervous_system | 6.32974 |
| FAC1 | tongue | 6.30343 |
| GCNF | lymph_node | 6.24293 |
| SP1 | small_intestine | 6.24181 |
| CDC5 | heart | 6.23661 |
| ERR_ALPHA | muscle | 6.19583 |
| STATX | larynx | 6.19488 |
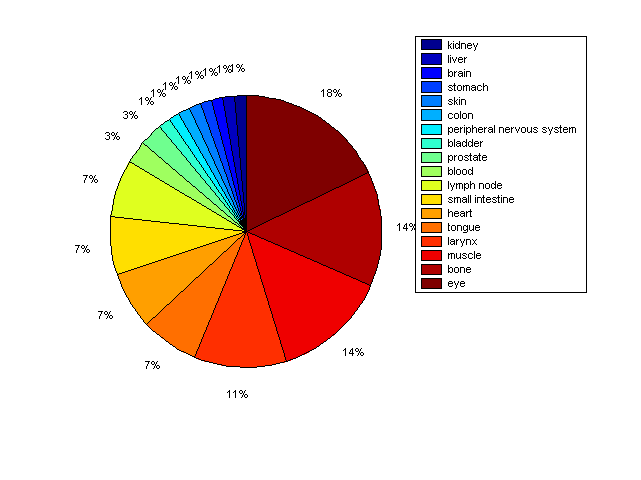
Distribution of Co-regulatory TFs
|
|
|
Description: this pie chart displays the distribution of co-regulatory transcription factors (TFs) in different tissues. Color schema: the tissue with the largest percentage of co-regulatory TFs is colored dark red whereas the tissue with the smallest percentage of co-regulatory TFs is colored dark blue. Tissues with intermediate percentages of co-regulatory TFs are colored from light red to yellow and cyan and then to light blue. |