Summary Table (Download Table)
| Co-regulatory TF | Tissue | -log(P) |
  | | |
| LHX3 | small_intestine | 21.4985 |
| HNF-1 | kidney | 20.1523 |
| RSRFC4 | muscle | 18.8713 |
| NKX6-2 | small_intestine | 17.7693 |
| MEF-2 | muscle | 17.0409 |
| FOXJ2 | eye | 17.007 |
| HEB | muscle | 14.2681 |
| HNF-4ALPHA | kidney | 13.414 |
| FOXD3 | small_intestine | 13.298 |
| PBX-1 | small_intestine | 12.9666 |
| MEF-2 | heart | 12.2252 |
| TBP | small_intestine | 12.1654 |
| C/EBPBETA | muscle | 12.0096 |
| CART-1 | small_intestine | 11.0178 |
| RFX1 | small_intestine | 10.6981 |
| LBP-1 | muscle | 10.5524 |
| SRF | muscle | 10.5245 |
| AREB6 | kidney | 10.1775 |
| COUP-TF/HNF-4 | kidney | 9.98714 |
| MRF-2 | small_intestine | 9.81669 |
| C/EBP | muscle | 9.52381 |
| OCT-1 | bone | 9.40133 |
| ALX-4 | small_intestine | 9.15272 |
| MYOD | muscle | 9.13866 |
| HNF-4 | kidney | 9.06489 |
| HNF-1 | small_intestine | 8.97156 |
| RSRFC4 | heart | 8.88988 |
| ATF | kidney | 8.88207 |
| TAL-1ALPHA/E47 | small_intestine | 8.87886 |
| TEF-1 | soft_tissue | 8.79961 |
| HNF-3ALPHA | small_intestine | 8.72678 |
| STAT6 | kidney | 8.61878 |
| HFH-4 | small_intestine | 8.5275 |
| FOXJ2 | small_intestine | 8.16241 |
| PAX-8 | small_intestine | 8.04426 |
| ALPHA-CP1 | eye | 8.02796 |
| AP-4 | muscle | 7.96958 |
| CREB | kidney | 7.95918 |
| NF-1 | kidney | 7.93247 |
| CDP | small_intestine | 7.86957 |
| C/EBP | small_intestine | 7.86886 |
| CRE-BP1/C-JUN | kidney | 7.80383 |
| HFH-3 | small_intestine | 7.77035 |
| OCT-1 | small_intestine | 7.66458 |
| PAX-8 | soft_tissue | 7.66394 |
| C/EBPGAMMA | kidney | 7.59509 |
| MEIS1A/HOXA9 | small_intestine | 7.56709 |
| PBX-1 | eye | 7.5068 |
| FREAC-3 | small_intestine | 7.43517 |
| NF-Y | eye | 7.31645 |
| TITF1 | small_intestine | 7.31055 |
| CREB | eye | 7.22831 |
| C-MYB | kidney | 7.19781 |
| C/EBPBETA | liver | 7.1232 |
| MYOGENIN/NF-1 | kidney | 7.04344 |
| DBP | soft_tissue | 6.94911 |
| OCT-1 | eye | 6.8532 |
| MEIS1B/HOXA9 | small_intestine | 6.72351 |
| SREBP-1 | muscle | 6.71783 |
| SRY | small_intestine | 6.67947 |
| CRE-BP1 | kidney | 6.56758 |
| STAT1 | kidney | 6.55545 |
| POU3F2 | small_intestine | 6.55258 |
| FOXO4 | eye | 6.5396 |
| PBX1B | small_intestine | 6.45725 |
| NF-E2 | muscle | 6.42214 |
| OCT-X | kidney | 6.41038 |
| TCF-4 | small_intestine | 6.40798 |
| STAT4 | testis | 6.39698 |
| AFP1 | small_intestine | 6.39176 |
| NKX6-1 | bone | 6.30725 |
| RREB-1 | muscle | 6.24551 |
| SOX-9 | eye | 6.21769 |
| HLF | kidney | 6.19384 |
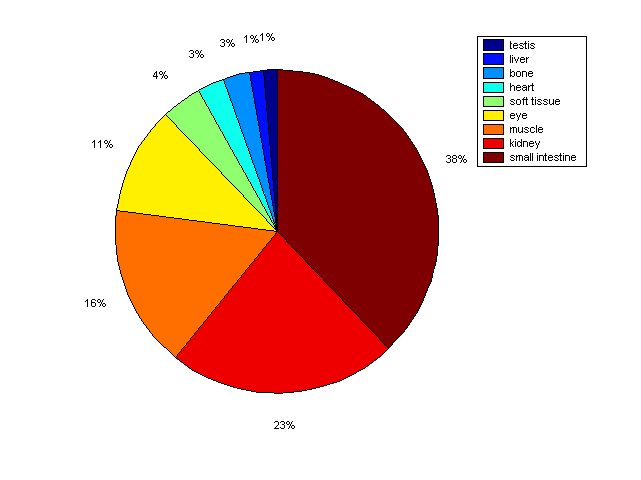
Distribution of Co-regulatory TFs
|
|
|
Description: this pie chart displays the distribution of co-regulatory transcription factors (TFs) in different tissues. Color schema: the tissue with the largest percentage of co-regulatory TFs is colored dark red whereas the tissue with the smallest percentage of co-regulatory TFs is colored dark blue. Tissues with intermediate percentages of co-regulatory TFs are colored from light red to yellow and cyan and then to light blue. |