Summary Table (Download Table)
| Co-regulatory TF | Tissue | -log(P) |
  | | |
| ATF | pancreas | 12.6265 |
| FREAC-7 | brain | 11.3341 |
| RSRFC4 | heart | 10.8271 |
| LBP-1 | muscle | 10.2945 |
| OCT-1 | brain | 8.69783 |
| CRX | eye | 8.04848 |
| NF-KAPPAB | brain | 7.86328 |
| PU.1 | lymph_node | 7.81676 |
| NF-E2 | skin | 7.7162 |
| AMEF-2 | muscle | 7.61111 |
| RREB-1 | heart | 7.56381 |
| C/EBPBETA | brain | 7.426 |
| RORALPHA2 | larynx | 7.13736 |
| NF-E2 | eye | 7.11116 |
| FOXO3 | spleen | 7.07858 |
| HNF-1 | kidney | 7.07276 |
| TAL-1ALPHA/E47 | muscle | 6.82641 |
| RREB-1 | brain | 6.74913 |
| HNF-1 | ovary | 6.63941 |
| FREAC-3 | spleen | 6.60002 |
| SREBP-1 | bone_marrow | 6.59444 |
| ATF-1 | pancreas | 6.53303 |
| HLF | uterus | 6.52733 |
| FOXO4 | brain | 6.50403 |
| SRF | peripheral_nervous_system | 6.41224 |
| ER | small_intestine | 6.32919 |
| E4BP4 | uterus | 6.32818 |
| BACH2 | skin | 6.27907 |
| E47 | brain | 6.23921 |
| OCT-1 | lymph_node | 6.23612 |
| C-MYC/MAX | bone | 6.19911 |
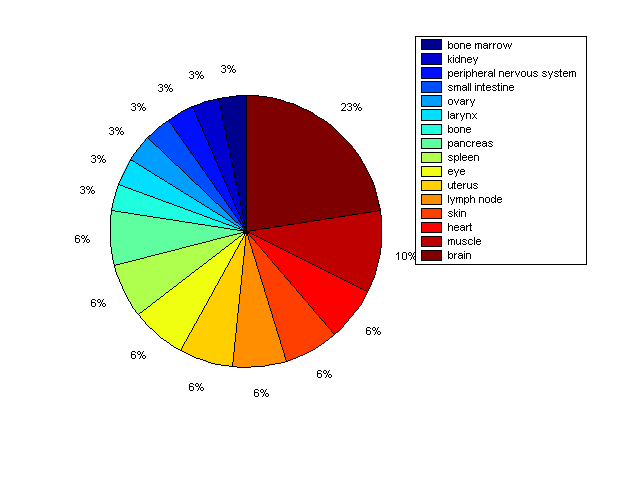
Distribution of Co-regulatory TFs
|
|
|
Description: this pie chart displays the distribution of co-regulatory transcription factors (TFs) in different tissues. Color schema: the tissue with the largest percentage of co-regulatory TFs is colored dark red whereas the tissue with the smallest percentage of co-regulatory TFs is colored dark blue. Tissues with intermediate percentages of co-regulatory TFs are colored from light red to yellow and cyan and then to light blue. |