Summary Table (Download Table)
| Co-regulatory TF | Tissue | -log(P) |
  | | |
| ERR_ALPHA | muscle | 28.1386 |
| TAL-1BETA/ITF-2 | muscle | 21.4048 |
| ATF | pancreas | 19.3647 |
| TAL-1ALPHA/E47 | muscle | 17.7634 |
| NF-1 | muscle | 15.5506 |
| C/EBPBETA | muscle | 15.5396 |
| NR2E3 | muscle | 14.2681 |
| TAL-1BETA/E47 | muscle | 13.6493 |
| LBP-1 | brain | 13.6006 |
| SRF | heart | 12.6273 |
| MAZ | small_intestine | 12.5285 |
| RSRFC4 | heart | 12.4663 |
| SP1 | testis | 12.3069 |
| TFII-I | brain | 12.0255 |
| LBP-1 | bone | 11.6555 |
| MEF-2 | heart | 10.7813 |
| GATA-1 | heart | 10.3071 |
| MIF-1 | skin | 9.94681 |
| NF-Y | muscle | 9.90886 |
| EGR-2 | skin | 9.72844 |
| NF-KAPPAB | small_intestine | 9.56352 |
| USF | muscle | 9.22134 |
| HNF-1 | colon | 9.09371 |
| OCT-X | lymph_node | 9.05187 |
| ATF | tongue | 8.99065 |
| LMO2_COMPLEX | heart | 8.98146 |
| NF-KAPPAB_(P65) | small_intestine | 8.97878 |
| LBP-1 | blood | 8.96519 |
| GCNF | muscle | 8.93288 |
| SP1 | pancreas | 8.83094 |
| AP-4 | bone | 8.80839 |
| ATF-1 | pancreas | 8.80577 |
| E12 | muscle | 8.68628 |
| AREB6 | eye | 8.45399 |
| SRF | prostate | 8.45194 |
| HNF-1 | kidney | 8.44484 |
| CACCC-BINDING_FACTOR | ovary | 8.40498 |
| NF-E2 | eye | 8.3157 |
| CHOP-C/EBPALPHA | muscle | 8.21246 |
| ATF | skin | 8.12148 |
| HIF-1 | testis | 8.00996 |
| CREB | pancreas | 8.00505 |
| SMAD-4 | spleen | 7.92618 |
| SREBP-1 | bone_marrow | 7.82852 |
| NF-Y | bladder | 7.82391 |
| ATF3 | pancreas | 7.78859 |
| OCT-1 | lymph_node | 7.78833 |
| SRY | muscle | 7.76064 |
| ATF | testis | 7.7216 |
| CRE-BP1/C-JUN | pancreas | 7.69665 |
| FOXD3 | larynx | 7.69293 |
| HNF-4ALPHA | muscle | 7.68618 |
| LBP-1 | spleen | 7.63142 |
| C-REL | small_intestine | 7.58651 |
| LBP-1 | lymph_node | 7.41339 |
| GATA-2 | kidney | 7.39176 |
| AP-4 | blood | 7.32316 |
| P53 | larynx | 7.27793 |
| TAX/CREB | larynx | 7.20654 |
| CREB | testis | 7.09405 |
| SP3 | ovary | 7.08922 |
| E2F | small_intestine | 7.07722 |
| HAND1/E47 | eye | 7.03163 |
| CREB | soft_tissue | 7.0211 |
| E2F-4/DP-1 | small_intestine | 6.97968 |
| COUP-TF/HNF-4 | pancreas | 6.92985 |
| E2F-1 | testis | 6.89928 |
| EGR-3 | ovary | 6.89833 |
| CRE-BP1/C-JUN | testis | 6.89613 |
| PPARG | muscle | 6.88875 |
| RB/E2F-1/DP-1 | small_intestine | 6.86681 |
| MYOD | pancreas | 6.83554 |
| GATA-6 | heart | 6.70602 |
| SREBP-1 | larynx | 6.6289 |
| E47 | cervix | 6.61038 |
| PPARALPHA/RXR-ALPHA | muscle | 6.60146 |
| AHR/ARNT | brain | 6.55664 |
| NF-KAPPAB_(P50) | soft_tissue | 6.55446 |
| MAZR | testis | 6.52216 |
| SMAD-4 | testis | 6.51734 |
| C-MYC/MAX | bone | 6.4643 |
| SOX-9 | muscle | 6.42365 |
| NF-MUE1 | larynx | 6.31822 |
| FOXJ2 | mammary_gland | 6.19471 |
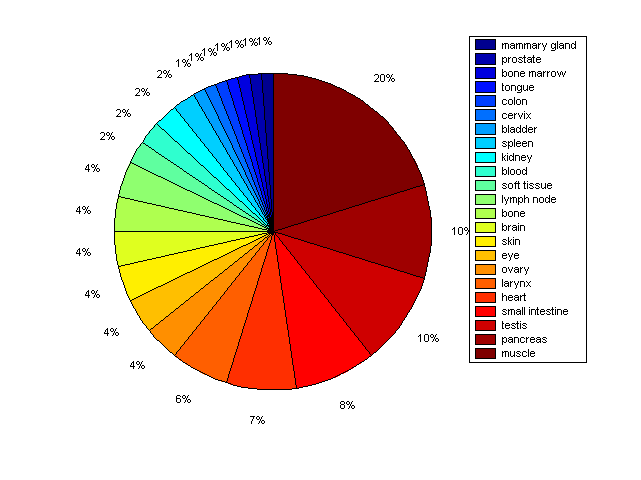
Distribution of Co-regulatory TFs
|
|
|
Description: this pie chart displays the distribution of co-regulatory transcription factors (TFs) in different tissues. Color schema: the tissue with the largest percentage of co-regulatory TFs is colored dark red whereas the tissue with the smallest percentage of co-regulatory TFs is colored dark blue. Tissues with intermediate percentages of co-regulatory TFs are colored from light red to yellow and cyan and then to light blue. |