Summary Table (Download Table)
| Co-regulatory TF | Tissue | -log(P) |
  | | |
| NRF-1 | testis | 22.3826 |
| SMAD-3 | brain | 12.9888 |
| AP-2ALPHA | brain | 10.3461 |
| ETF | thymus | 9.27951 |
| MAZ | small_intestine | 9.10794 |
| EGR-2 | pancreas | 9.04706 |
| SRF | soft_tissue | 8.62388 |
| C-MYC/MAX | bone | 8.48085 |
| CACCC-BINDING_FACTOR | brain | 8.43443 |
| SMAD-4 | brain | 8.39635 |
| ETF | testis | 7.895 |
| AHR/ARNT | brain | 7.63687 |
| MAZ | thymus | 7.55743 |
| AP-2GAMMA | brain | 7.09022 |
| AP-4 | skin | 7.08999 |
| EGR-3 | pancreas | 7.00777 |
| NRF-1 | thymus | 6.98666 |
| ATF6 | bone | 6.95955 |
| AP-2 | testis | 6.79014 |
| FREAC-4 | brain | 6.76594 |
| GCNF | mammary_gland | 6.73223 |
| EGR-2 | brain | 6.64146 |
| LBP-1 | lymph_node | 6.59979 |
| EGR-3 | testis | 6.51066 |
| HIF-1 | brain | 6.41211 |
| AMEF-2 | brain | 6.40814 |
| ETF | cervix | 6.3094 |
| ARNT | brain | 6.29853 |
| RSRFC4 | heart | 6.2455 |
| ETF | stomach | 6.22038 |
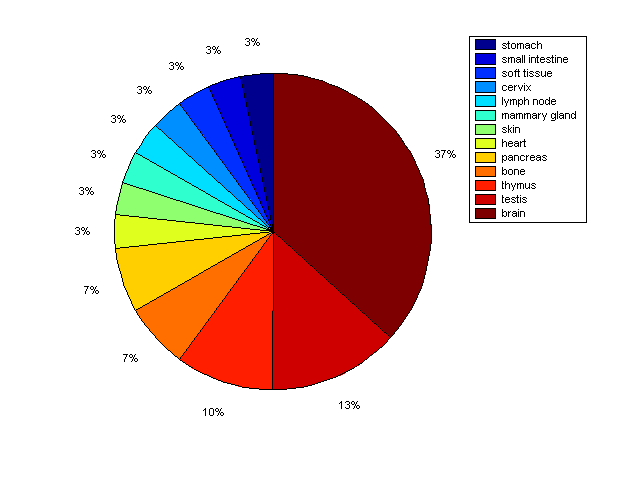
Distribution of Co-regulatory TFs
|
|
|
Description: this pie chart displays the distribution of co-regulatory transcription factors (TFs) in different tissues. Color schema: the tissue with the largest percentage of co-regulatory TFs is colored dark red whereas the tissue with the smallest percentage of co-regulatory TFs is colored dark blue. Tissues with intermediate percentages of co-regulatory TFs are colored from light red to yellow and cyan and then to light blue. |