Summary Table (Download Table)
| Co-regulatory TF | Tissue | -log(P) |
  | | |
| HNF-1 | small_intestine | 16.361 |
| SMAD-3 | cervix | 13.8367 |
| LHX3 | small_intestine | 12.0241 |
| ISRE | lymph_node | 11.8048 |
| MIF-1 | small_intestine | 11.6697 |
| CRX | small_intestine | 10.2656 |
| TATA | peripheral_nervous_system | 10.1655 |
| PEA3 | lymph_node | 9.70025 |
| NKX6-2 | small_intestine | 9.33009 |
| C/EBPDELTA | soft_tissue | 8.81946 |
| POU3F2 | small_intestine | 8.73447 |
| SRF | small_intestine | 8.60894 |
| EF-C | small_intestine | 8.25973 |
| HOXA4 | soft_tissue | 8.13963 |
| OCT-1 | bone | 7.84 |
| FREAC-4 | soft_tissue | 7.6497 |
| ICSBP | lymph_node | 7.63762 |
| CDP | small_intestine | 7.4568 |
| CACCC-BINDING_FACTOR | small_intestine | 7.15443 |
| PPARG | heart | 7.12639 |
| E2F | tongue | 6.86875 |
| C-ETS-1 | lymph_node | 6.86283 |
| TEF-1 | soft_tissue | 6.67434 |
| ELK-1 | lymph_node | 6.52376 |
| CART-1 | peripheral_nervous_system | 6.50014 |
| C-ETS-2 | lymph_node | 6.46702 |
| C/EBP | skin | 6.45296 |
| DBP | soft_tissue | 6.42468 |
| STAT5B_(HOMODIMER) | heart | 6.41833 |
| MEIS1A/HOXA9 | small_intestine | 6.27802 |
| STAT6 | lung | 6.25307 |
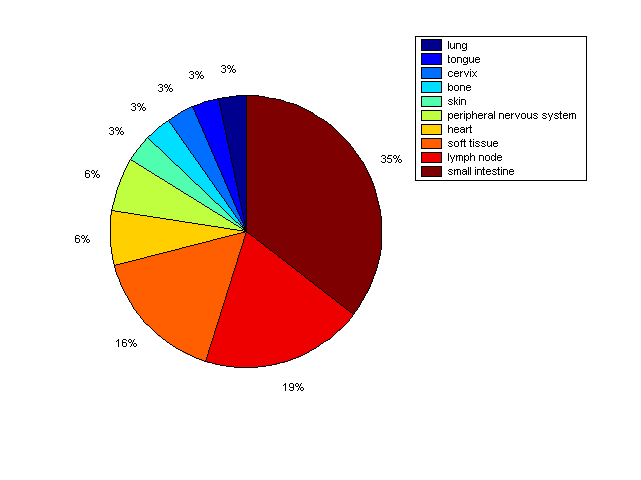
Distribution of Co-regulatory TFs
|
|
|
Description: this pie chart displays the distribution of co-regulatory transcription factors (TFs) in different tissues. Color schema: the tissue with the largest percentage of co-regulatory TFs is colored dark red whereas the tissue with the smallest percentage of co-regulatory TFs is colored dark blue. Tissues with intermediate percentages of co-regulatory TFs are colored from light red to yellow and cyan and then to light blue. |