Summary Table (Download Table)
| Co-regulatory TF | Tissue | -log(P) |
  | | |
| CREB | larynx | 14.1679 |
| E2F-1 | larynx | 13.0987 |
| MEF-2 | muscle | 12.7623 |
| E2F-4/DP-2 | larynx | 12.3222 |
| ETF | mammary_gland | 12.1985 |
| SRF | muscle | 10.8825 |
| LBP-1 | brain | 10.0274 |
| RB/E2F-1/DP-1 | larynx | 9.80538 |
| E2F-1/DP-1 | larynx | 9.7865 |
| TATA | muscle | 9.6263 |
| ELK-1 | small_intestine | 9.01208 |
| NRF-1 | testis | 8.93525 |
| GCM | larynx | 8.80274 |
| SRF | heart | 8.71671 |
| GR | muscle | 8.58552 |
| P53 | larynx | 8.4873 |
| SREBP-1 | stomach | 8.47636 |
| E2F-4/DP-1 | small_intestine | 8.4599 |
| NF-1 | muscle | 8.42548 |
| AP-4 | brain | 8.20659 |
| LUN-1 | small_intestine | 8.18712 |
| E47 | tongue | 8.08777 |
| NF-1 | larynx | 7.92401 |
| USF2 | small_intestine | 7.50291 |
| ATF | larynx | 7.46495 |
| COUP-TF/HNF-4 | larynx | 7.41116 |
| CRE-BP1 | larynx | 7.31583 |
| ARNT | small_intestine | 7.29273 |
| WHN | small_intestine | 7.27152 |
| SRF | small_intestine | 7.20726 |
| TFII-I | muscle | 7.19098 |
| GR | larynx | 7.02407 |
| PEA3 | stomach | 7.02204 |
| USF | small_intestine | 7.01331 |
| SREBP-1 | small_intestine | 6.99254 |
| PAX-8 | larynx | 6.99178 |
| HNF-4 | larynx | 6.97223 |
| MEF-2 | heart | 6.95721 |
| PAX-1 | kidney | 6.95585 |
| CRE-BP1 | kidney | 6.94653 |
| LMO2_COMPLEX | kidney | 6.76625 |
| E2F | small_intestine | 6.71442 |
| IRF-1 | brain | 6.69797 |
| MIF-1 | muscle | 6.5008 |
| GR | small_intestine | 6.49999 |
| LUN-1 | larynx | 6.36962 |
| NF-Y | bladder | 6.34435 |
| NRF-1 | larynx | 6.19611 |
| NF-Y | peripheral_nervous_system | 6.17128 |
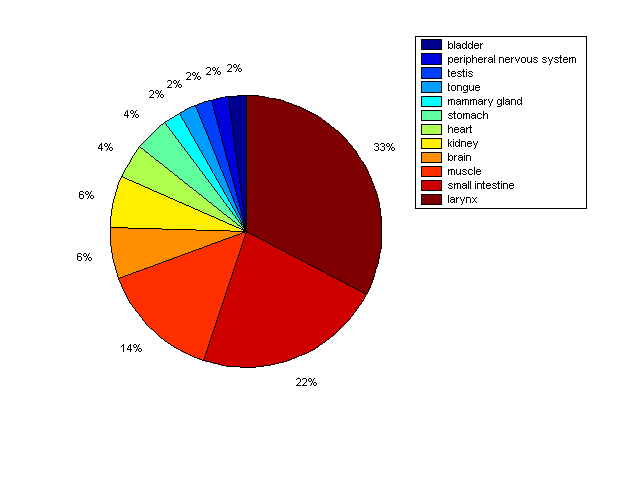
Distribution of Co-regulatory TFs
|
|
|
Description: this pie chart displays the distribution of co-regulatory transcription factors (TFs) in different tissues. Color schema: the tissue with the largest percentage of co-regulatory TFs is colored dark red whereas the tissue with the smallest percentage of co-regulatory TFs is colored dark blue. Tissues with intermediate percentages of co-regulatory TFs are colored from light red to yellow and cyan and then to light blue. |