Summary Table (Download Table)
| Co-regulatory TF | Tissue | -log(P) |
  | | |
| ETF | brain | 11.4882 |
| SMAD-4 | brain | 11.4494 |
| TGIF | brain | 9.70543 |
| MAZR | lung | 9.68387 |
| ETF | tongue | 8.58917 |
| BSAP | lung | 8.50403 |
| ETF | larynx | 8.47673 |
| E2F | brain | 8.3386 |
| C-MYC/MAX | lung | 8.29598 |
| SRF | heart | 8.02008 |
| ARNT | brain | 7.76607 |
| VDR | brain | 7.72936 |
| SP1 | soft_tissue | 7.60378 |
| AP-2GAMMA | brain | 7.52317 |
| ALPHA-CP1 | small_intestine | 7.14802 |
| SRF | lung | 7.1327 |
| PU.1 | skin | 6.82698 |
| MAZ | larynx | 6.75836 |
| ARP-1 | muscle | 6.69537 |
| AP-2 | larynx | 6.60161 |
| SMAD-4 | mammary_gland | 6.52705 |
| E2F-1 | brain | 6.43917 |
| CRX | skin | 6.41443 |
| VDR | placenta | 6.20898 |
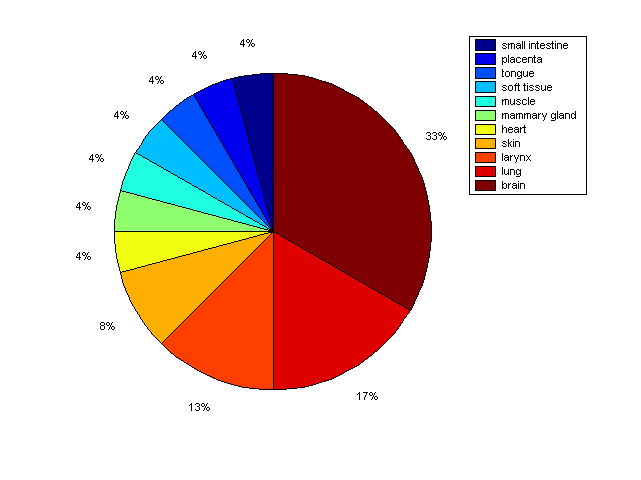
Distribution of Co-regulatory TFs
|
|
|
Description: this pie chart displays the distribution of co-regulatory transcription factors (TFs) in different tissues. Color schema: the tissue with the largest percentage of co-regulatory TFs is colored dark red whereas the tissue with the smallest percentage of co-regulatory TFs is colored dark blue. Tissues with intermediate percentages of co-regulatory TFs are colored from light red to yellow and cyan and then to light blue. |