Summary Table (Download Table)
| Co-regulatory TF | Tissue | -log(P) |
  | | |
| SRF | heart | 16.9494 |
| SMAD-3 | lung | 16.7819 |
| EF-C | bone | 15.2221 |
| GATA-2 | brain | 13.2472 |
| C-MYC/MAX | small_intestine | 12.7722 |
| E2F-1 | small_intestine | 12.2743 |
| E2F | tongue | 12.0398 |
| AREB6 | small_intestine | 11.4258 |
| SP1 | soft_tissue | 10.7468 |
| SRY | small_intestine | 10.6209 |
| E2F-4/DP-1 | tongue | 10.3939 |
| SRF | muscle | 10.285 |
| SRF | soft_tissue | 10.264 |
| MIF-1 | bone | 10.2453 |
| E2F | larynx | 10.1355 |
| C/EBPBETA | peripheral_nervous_system | 10.1307 |
| MTF-1 | lung | 9.68387 |
| WHN | small_intestine | 9.62467 |
| RFX1 | bone | 9.57418 |
| COUP-TF/HNF-4 | muscle | 9.4943 |
| SRF | peripheral_nervous_system | 9.3056 |
| P53 | small_intestine | 9.03513 |
| TAL-1ALPHA/E47 | muscle | 8.84295 |
| LBP-1 | muscle | 8.70485 |
| C/EBP | peripheral_nervous_system | 8.70436 |
| USF | small_intestine | 8.69993 |
| ATF | brain | 8.65741 |
| ALPHA-CP1 | lung | 8.65701 |
| C-MYC/MAX | testis | 8.43352 |
| CREB | brain | 8.14438 |
| FOXD3 | peripheral_nervous_system | 7.94723 |
| HNF-3ALPHA | peripheral_nervous_system | 7.9148 |
| HNF-3ALPHA | small_intestine | 7.86141 |
| RB/E2F-1/DP-1 | tongue | 7.81823 |
| MYOD | small_intestine | 7.51867 |
| AP-2ALPHA | stomach | 7.47354 |
| MAZ | small_intestine | 7.39347 |
| MZF1 | small_intestine | 7.34769 |
| RREB-1 | brain | 7.33652 |
| OCT-X | lymph_node | 7.27664 |
| GATA-3 | brain | 7.26187 |
| ATF3 | brain | 7.22865 |
| NF-1 | brain | 7.22135 |
| NRF-1 | testis | 7.109 |
| ATF | spleen | 7.10581 |
| SREBP-1 | spleen | 7.08641 |
| SP1 | cervix | 7.074 |
| ATF | kidney | 7.05539 |
| E2F-1/DP-1 | larynx | 6.99943 |
| AREB6 | pancreas | 6.99446 |
| CRE-BP1/C-JUN | brain | 6.92547 |
| MYOGENIN/NF-1 | brain | 6.90933 |
| MEIS1 | muscle | 6.86997 |
| CREB | spleen | 6.8533 |
| SP1 | small_intestine | 6.80085 |
| CDP_CR1 | lung | 6.78529 |
| AHR/ARNT | brain | 6.76287 |
| ETF | larynx | 6.76196 |
| OCT-1 | lymph_node | 6.72323 |
| CDP_CR3+HD | lung | 6.71908 |
| CREB | peripheral_nervous_system | 6.6901 |
| E2F-4/DP-2 | larynx | 6.56875 |
| ETF | stomach | 6.56842 |
| E2F-1/DP-2 | larynx | 6.55032 |
| E12 | pancreas | 6.53519 |
| CREB | soft_tissue | 6.52661 |
| HEB | testis | 6.52216 |
| E2F-4/DP-1 | larynx | 6.49322 |
| ETF | testis | 6.47037 |
| TGIF | muscle | 6.41244 |
| SMAD-3 | muscle | 6.39221 |
| RB/E2F-1/DP-1 | larynx | 6.34894 |
| MEF-2 | muscle | 6.34158 |
| BSAP | small_intestine | 6.2066 |
| NF-Y | larynx | 6.20477 |
| E2F-1 | larynx | 6.19746 |
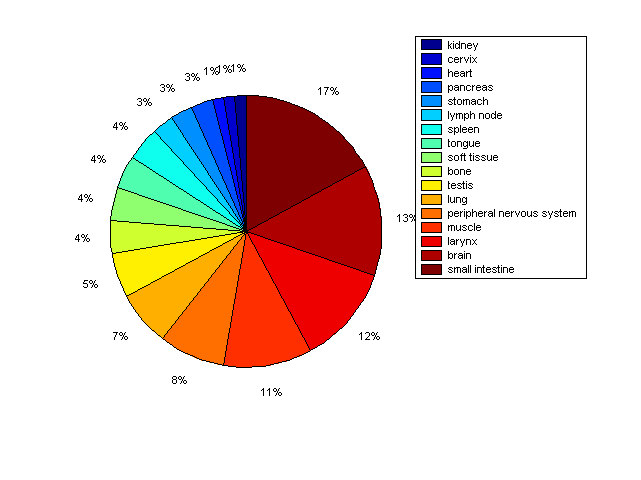
Distribution of Co-regulatory TFs
|
|
|
Description: this pie chart displays the distribution of co-regulatory transcription factors (TFs) in different tissues. Color schema: the tissue with the largest percentage of co-regulatory TFs is colored dark red whereas the tissue with the smallest percentage of co-regulatory TFs is colored dark blue. Tissues with intermediate percentages of co-regulatory TFs are colored from light red to yellow and cyan and then to light blue. |