Summary Table (Download Table)
| Co-regulatory TF | Tissue | -log(P) |
  | | |
| C-ETS-1 | thymus | 18.1202 |
| NRF-1 | bone_marrow | 12.2958 |
| AREB6 | larynx | 11.6158 |
| PU.1 | blood | 11.5973 |
| ELK-1 | lymph_node | 11.4787 |
| C-ETS-2 | spleen | 11.1953 |
| E2F-4/DP-1 | small_intestine | 10.8429 |
| PU.1 | thymus | 10.8256 |
| PEA3 | lymph_node | 10.8116 |
| C-ETS-1 | lymph_node | 10.7977 |
| AP-2 | spleen | 10.4357 |
| AP-2REP | brain | 9.76223 |
| C-ETS-2 | thymus | 9.51362 |
| ETF | larynx | 9.49299 |
| E2F | small_intestine | 9.43662 |
| WHN | small_intestine | 9.27934 |
| STAT1 | blood | 9.13164 |
| AP-2GAMMA | spleen | 8.84513 |
| C-ETS-2 | lymph_node | 8.77722 |
| GCNF | brain | 8.62904 |
| LBP-1 | spleen | 8.57483 |
| E12 | lymph_node | 8.33908 |
| LBP-1 | larynx | 8.31934 |
| NF-KAPPAB | spleen | 8.07451 |
| BSAP | ovary | 7.911 |
| PEA3 | stomach | 7.81896 |
| NRF-1 | bladder | 7.69906 |
| STAT6 | thymus | 7.35574 |
| MYOD | lymph_node | 7.34434 |
| RORALPHA1 | soft_tissue | 7.30502 |
| MEIS1 | larynx | 7.27976 |
| CACCC-BINDING_FACTOR | spleen | 7.26709 |
| RREB-1 | spleen | 7.26544 |
| FREAC-3 | skin | 7.26529 |
| GATA-X | thymus | 7.17769 |
| CDP_CR3+HD | muscle | 7.0579 |
| ELK-1 | thymus | 6.90834 |
| ATF | bone | 6.90775 |
| OSF2 | blood | 6.88295 |
| AP-4 | spleen | 6.86791 |
| AREB6 | brain | 6.78552 |
| ARP-1 | cervix | 6.77867 |
| ELK-1 | bone_marrow | 6.65381 |
| MZF1 | bone_marrow | 6.60588 |
| C/EBP | soft_tissue | 6.59518 |
| WHN | colon | 6.56517 |
| AMEF-2 | thymus | 6.54729 |
| SREBP-1 | thymus | 6.5173 |
| SRF | muscle | 6.47593 |
| CACCC-BINDING_FACTOR | lymph_node | 6.4536 |
| PEA3 | blood | 6.38837 |
| MYOGENIN/NF-1 | soft_tissue | 6.35051 |
| RREB-1 | soft_tissue | 6.30711 |
| E12 | stomach | 6.2333 |
| TATA | larynx | 6.21489 |
| EF-C | bone | 6.21014 |
| LUN-1 | soft_tissue | 6.19988 |
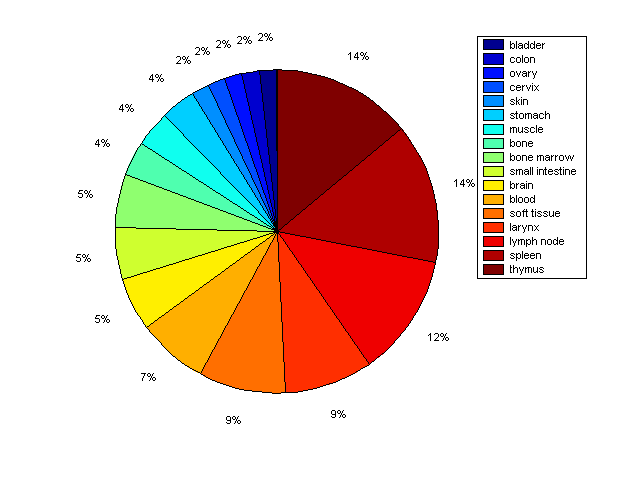
Distribution of Co-regulatory TFs
|
|
|
Description: this pie chart displays the distribution of co-regulatory transcription factors (TFs) in different tissues. Color schema: the tissue with the largest percentage of co-regulatory TFs is colored dark red whereas the tissue with the smallest percentage of co-regulatory TFs is colored dark blue. Tissues with intermediate percentages of co-regulatory TFs are colored from light red to yellow and cyan and then to light blue. |