Summary Table (Download Table)
| Co-regulatory TF | Tissue | -log(P) |
  | | |
| POU3F2 | heart | 16.1128 |
| COUP-TF/HNF-4 | small_intestine | 15.7545 |
| FREAC-3 | small_intestine | 14.0072 |
| NR2E3 | small_intestine | 13.298 |
| NKX6-2 | small_intestine | 12.9759 |
| PAX-2 | small_intestine | 12.6603 |
| HNF-4ALPHA | small_intestine | 12.608 |
| LHX3 | small_intestine | 12.3017 |
| PBX-1 | small_intestine | 12.16 |
| WHN | small_intestine | 11.9811 |
| HNF-1 | liver | 11.6256 |
| MRF-2 | small_intestine | 11.5708 |
| TATA | small_intestine | 11.5631 |
| TBP | small_intestine | 11.2223 |
| ATF | pancreas | 10.0884 |
| TITF1 | eye | 10.032 |
| PBX1B | small_intestine | 9.97067 |
| FREAC-7 | brain | 9.94411 |
| TCF-4 | small_intestine | 9.77996 |
| NKX3A | small_intestine | 9.77977 |
| OCT-1 | muscle | 9.75618 |
| C/EBP | brain | 9.69407 |
| TBP | brain | 9.60412 |
| GATA-6 | brain | 9.54691 |
| E4BP4 | brain | 9.35488 |
| GATA-X | brain | 8.96202 |
| FREAC-4 | small_intestine | 8.80583 |
| CHX10 | brain | 8.74064 |
| OCT-1 | small_intestine | 8.53637 |
| SOX-9 | brain | 8.449 |
| TFII-I | larynx | 8.34814 |
| HNF-1 | small_intestine | 8.23358 |
| PPARG | kidney | 8.12254 |
| TAL-1ALPHA/E47 | small_intestine | 8.08539 |
| MAZR | peripheral_nervous_system | 7.94723 |
| AML-1A | muscle | 7.82128 |
| AML1 | muscle | 7.82128 |
| EF-C | small_intestine | 7.74777 |
| SRF | muscle | 7.7301 |
| HEB | larynx | 7.69293 |
| CACCC-BINDING_FACTOR | peripheral_nervous_system | 7.66485 |
| TITF1 | small_intestine | 7.65536 |
| OSF2 | bone_marrow | 7.55972 |
| FREAC-3 | colon | 7.53485 |
| CART-1 | small_intestine | 7.38575 |
| HNF-3ALPHA | small_intestine | 7.37293 |
| STAT5A_(HOMOTETRAMER) | eye | 7.3208 |
| FOXO4 | small_intestine | 7.19202 |
| E4BP4 | lymph_node | 7.19149 |
| TGIF | prostate | 7.15433 |
| ETF | peripheral_nervous_system | 7.14721 |
| FOXO1 | liver | 6.99211 |
| SP3 | peripheral_nervous_system | 6.99119 |
| MEIS1B/HOXA9 | small_intestine | 6.95143 |
| HLF | brain | 6.91626 |
| FOXO1 | small_intestine | 6.79085 |
| POU3F2 | bone | 6.77552 |
| LHX3 | brain | 6.70648 |
| TAL-1ALPHA/E47 | brain | 6.70486 |
| C/EBP | muscle | 6.57066 |
| LHX3 | lung | 6.51565 |
| FOXO4 | liver | 6.46416 |
| E2F | heart | 6.44101 |
| HFH-4 | small_intestine | 6.39606 |
| OCT-1 | brain | 6.38918 |
| C/EBP | small_intestine | 6.34236 |
| PPAR | colon | 6.27502 |
| HNF-3ALPHA | liver | 6.20028 |
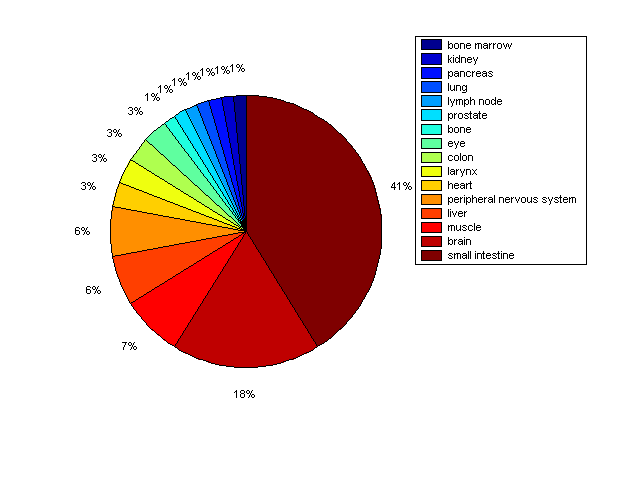
Distribution of Co-regulatory TFs
|
|
|
Description: this pie chart displays the distribution of co-regulatory transcription factors (TFs) in different tissues. Color schema: the tissue with the largest percentage of co-regulatory TFs is colored dark red whereas the tissue with the smallest percentage of co-regulatory TFs is colored dark blue. Tissues with intermediate percentages of co-regulatory TFs are colored from light red to yellow and cyan and then to light blue. |