Summary Table (Download Table)
| Co-regulatory TF | Tissue | -log(P) |
  | | |
| HNF-1 | kidney | 28.4158 |
| NKX6-2 | small_intestine | 17.2879 |
| CRX | kidney | 16.8834 |
| SRF | kidney | 16.4428 |
| COUP-TF/HNF-4 | kidney | 14.5075 |
| HNF-1 | liver | 13.9526 |
| NR2E3 | kidney | 13.414 |
| OCT-1 | kidney | 12.8393 |
| FOXD3 | small_intestine | 12.608 |
| RSRFC4 | muscle | 11.9467 |
| AREB6 | kidney | 11.9258 |
| CDP | liver | 11.5469 |
| GATA-X | kidney | 11.3147 |
| TBP | small_intestine | 11.1709 |
| MRF-2 | small_intestine | 10.9255 |
| C/EBPBETA | muscle | 10.4411 |
| HNF-4 | kidney | 10.3217 |
| SREBP-1 | muscle | 9.84282 |
| DBP | liver | 9.78034 |
| GATA-1 | kidney | 9.60021 |
| MEF-2 | muscle | 9.58946 |
| GATA-1 | liver | 9.35388 |
| NF-KAPPAB_(P65) | kidney | 9.25744 |
| NKX2-2 | kidney | 8.86728 |
| PAX-8 | kidney | 8.79986 |
| HNF-4ALPHA | kidney | 8.77707 |
| FOXO4 | soft_tissue | 8.70178 |
| AP-3 | kidney | 8.59271 |
| MEIS1 | kidney | 8.58252 |
| TATA | muscle | 8.58247 |
| CHOP-C/EBPALPHA | brain | 8.3716 |
| PU.1 | liver | 8.10988 |
| OCT-1 | colon | 8.10276 |
| OCT-X | kidney | 7.98176 |
| AP-3 | heart | 7.8826 |
| HNF-3ALPHA | liver | 7.76942 |
| HEB | muscle | 7.68618 |
| C-REL | kidney | 7.54533 |
| FREAC-3 | small_intestine | 7.47942 |
| RFX1 | kidney | 7.46873 |
| FOXJ2 | colon | 7.39955 |
| POU3F2 | liver | 7.31602 |
| MYOGENIN/NF-1 | kidney | 7.28424 |
| HNF-4 | liver | 7.24435 |
| C/EBPBETA | liver | 7.09048 |
| TATA | colon | 7.05473 |
| LHX3 | small_intestine | 7.04063 |
| CART-1 | liver | 7.0007 |
| NKX3A | small_intestine | 6.95665 |
| TGIF | muscle | 6.8973 |
| HNF-1 | small_intestine | 6.82829 |
| SRF | muscle | 6.82433 |
| FOXO3 | soft_tissue | 6.7856 |
| C/EBP | liver | 6.76995 |
| FOXO4 | kidney | 6.7308 |
| AREB6 | stomach | 6.69522 |
| AP-4 | muscle | 6.6254 |
| NKX6-2 | colon | 6.50642 |
| CRX | eye | 6.30925 |
| C/EBP | muscle | 6.29107 |
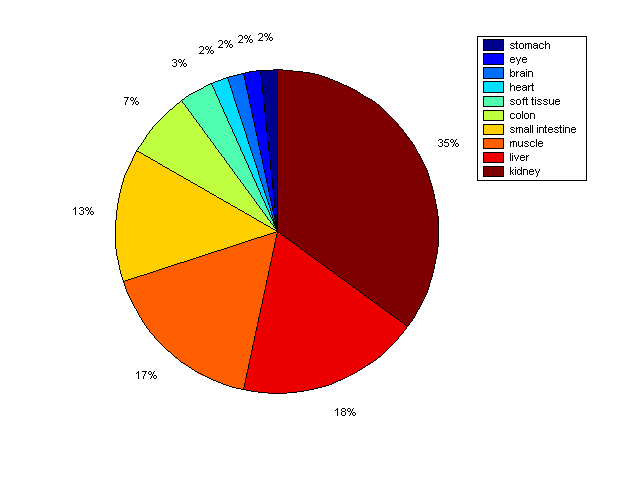
Distribution of Co-regulatory TFs
|
|
|
Description: this pie chart displays the distribution of co-regulatory transcription factors (TFs) in different tissues. Color schema: the tissue with the largest percentage of co-regulatory TFs is colored dark red whereas the tissue with the smallest percentage of co-regulatory TFs is colored dark blue. Tissues with intermediate percentages of co-regulatory TFs are colored from light red to yellow and cyan and then to light blue. |