Summary Table (Download Table)
| Co-regulatory TF | Tissue | -log(P) |
  | | |
| MYOD | muscle | 29.9185 |
| MEF-2 | heart | 24.0854 |
| LBP-1 | muscle | 19.6476 |
| SRF | muscle | 18.1996 |
| RREB-1 | muscle | 15.8031 |
| ARP-1 | muscle | 15.7425 |
| E12 | muscle | 15.2568 |
| AP-1 | muscle | 14.8992 |
| GATA-1 | heart | 14.494 |
| GATA-X | heart | 14.1574 |
| C-ETS-1 | thymus | 13.9224 |
| TCF-4 | heart | 12.7707 |
| AP-1 | heart | 12.2872 |
| STAT5B_(HOMODIMER) | heart | 12.242 |
| RREB-1 | heart | 12.1642 |
| SRF | heart | 11.3966 |
| PBX-1 | heart | 10.6715 |
| NKX6-2 | heart | 10.4457 |
| TAL-1ALPHA/E47 | heart | 10.127 |
| USF | muscle | 9.83443 |
| TEF | heart | 9.6474 |
| HNF-1 | peripheral_nervous_system | 9.45789 |
| PBX1B | heart | 9.14072 |
| OCT-1 | heart | 9.01805 |
| STAT5A_(HOMODIMER) | heart | 8.62798 |
| C/EBPBETA | heart | 8.4579 |
| POU3F2 | peripheral_nervous_system | 8.29906 |
| PEA3 | thymus | 8.26245 |
| OCT-X | brain | 8.11986 |
| FOXJ2 | blood | 7.81625 |
| SRY | brain | 7.80776 |
| NRL | muscle | 7.61111 |
| PAX-1 | muscle | 7.6037 |
| ARNT | muscle | 7.55039 |
| OCT-1 | brain | 7.41935 |
| HNF-4 | kidney | 7.16733 |
| YY1 | lung | 7.0913 |
| MIF-1 | brain | 7.04983 |
| LHX3 | brain | 6.9467 |
| COUP-TF/HNF-4 | small_intestine | 6.92319 |
| SOX-9 | brain | 6.91462 |
| FREAC-3 | heart | 6.76158 |
| TAL-1BETA/E47 | heart | 6.69652 |
| C/EBPGAMMA | soft_tissue | 6.62983 |
| FOXO4 | soft_tissue | 6.59917 |
| LHX3 | small_intestine | 6.59603 |
| ATF | tongue | 6.57903 |
| FAC1 | eye | 6.57658 |
| NKX3A | brain | 6.56256 |
| NERF1A | thymus | 6.54729 |
| AREB6 | brain | 6.49311 |
| OCT-1 | kidney | 6.47215 |
| NKX2-2 | brain | 6.46549 |
| EGR-1 | brain | 6.40814 |
| TATA | soft_tissue | 6.34535 |
| LHX3 | uterus | 6.32434 |
| NF-Y | brain | 6.31347 |
| TCF11 | brain | 6.21081 |
| CREB | tongue | 6.16808 |
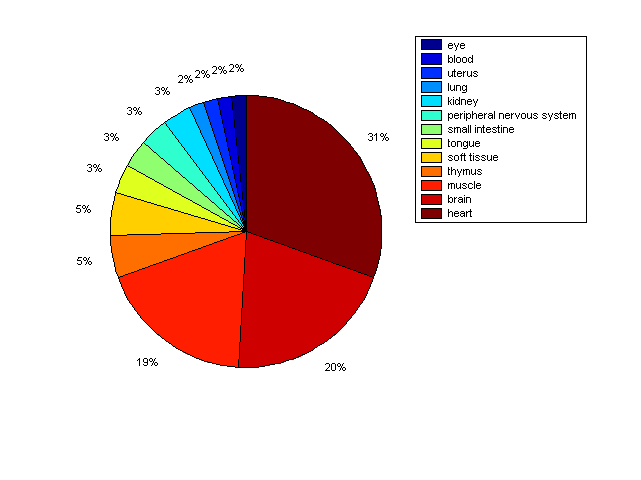
Distribution of Co-regulatory TFs
|
|
|
Description: this pie chart displays the distribution of co-regulatory transcription factors (TFs) in different tissues. Color schema: the tissue with the largest percentage of co-regulatory TFs is colored dark red whereas the tissue with the smallest percentage of co-regulatory TFs is colored dark blue. Tissues with intermediate percentages of co-regulatory TFs are colored from light red to yellow and cyan and then to light blue. |