Summary Table (Download Table)
| Co-regulatory TF | Tissue | -log(P) |
  | | |
| HEB | muscle | 15.5506 |
| MYOD | muscle | 13.5659 |
| ERR_ALPHA | muscle | 11.5332 |
| TFIIA | larynx | 9.83412 |
| HNF-1 | kidney | 9.53912 |
| MEF-2 | muscle | 8.97745 |
| POU3F2 | thymus | 8.895 |
| ZID | muscle | 8.42548 |
| POU1F1 | brain | 8.32014 |
| AP-2REP | peripheral_nervous_system | 8.24243 |
| E47 | muscle | 8.21208 |
| NR2E3 | kidney | 7.93247 |
| ZID | larynx | 7.92401 |
| CHX10 | brain | 7.89094 |
| E12 | muscle | 7.87238 |
| HNF-1 | liver | 7.83183 |
| NRF-1 | testis | 7.77804 |
| AP-4 | muscle | 7.68989 |
| SRF | larynx | 7.67747 |
| FREAC-4 | kidney | 7.5151 |
| HOXA4 | lung | 7.38936 |
| MAZR | brain | 7.22135 |
| NRF-1 | larynx | 7.09274 |
| USF | small_intestine | 7.06944 |
| TAX/CREB | brain | 6.97974 |
| C/EBPBETA | lung | 6.94306 |
| CRX | brain | 6.92373 |
| GATA-4 | larynx | 6.87525 |
| CHX10 | kidney | 6.7258 |
| AREB6 | testis | 6.70341 |
| NF-MUE1 | testis | 6.67768 |
| PEA3 | lymph_node | 6.54977 |
| AFP1 | placenta | 6.50511 |
| NF-Y | testis | 6.41257 |
| TAL-1BETA/ITF-2 | muscle | 6.28478 |
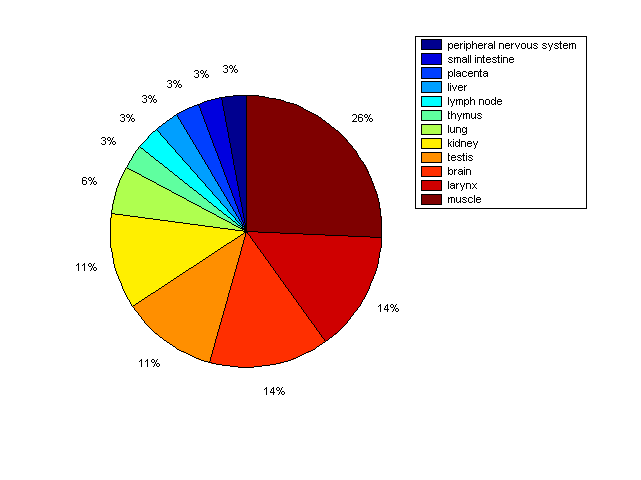
Distribution of Co-regulatory TFs
|
|
|
Description: this pie chart displays the distribution of co-regulatory transcription factors (TFs) in different tissues. Color schema: the tissue with the largest percentage of co-regulatory TFs is colored dark red whereas the tissue with the smallest percentage of co-regulatory TFs is colored dark blue. Tissues with intermediate percentages of co-regulatory TFs are colored from light red to yellow and cyan and then to light blue. |