Summary Table (Download Table)
| Co-regulatory TF | Tissue | -log(P) |
  | | |
| ELK-1 | small_intestine | 17.3843 |
| ETF | brain | 12.7743 |
| NRF-1 | testis | 11.662 |
| ETF | stomach | 11.1371 |
| LBP-1 | blood | 11.0982 |
| AP-2ALPHA | bone | 10.8372 |
| C-MYC/MAX | cervix | 10.0247 |
| SREBP-1 | larynx | 10.0099 |
| NF-KAPPAB | larynx | 9.79973 |
| LBP-1 | lymph_node | 9.51538 |
| NF-KAPPAB | ovary | 9.47718 |
| AP-2ALPHA | tongue | 8.88689 |
| NERF1A | spleen | 8.84513 |
| P53 | tongue | 8.28205 |
| ETF | lymph_node | 8.13311 |
| ETF | bone | 8.07265 |
| ETF | eye | 7.98615 |
| E47 | cervix | 7.89896 |
| ETF | placenta | 7.80566 |
| SMAD-3 | brain | 7.78427 |
| P53 | larynx | 7.76791 |
| CACCC-BINDING_FACTOR | muscle | 7.72384 |
| AP-2 | cervix | 7.69886 |
| SP1 | testis | 7.68632 |
| ARNT | larynx | 7.67775 |
| LBP-1 | brain | 7.6358 |
| AHR/ARNT | brain | 7.63569 |
| MTF-1 | brain | 7.52317 |
| TFII-I | larynx | 7.44193 |
| AP-2ALPHA | cervix | 7.36096 |
| LBP-1 | spleen | 7.16314 |
| SP1 | small_intestine | 7.15669 |
| EGR-1 | brain | 7.09022 |
| CACCC-BINDING_FACTOR | eye | 7.04953 |
| FREAC-7 | lung | 7.0471 |
| SRF | larynx | 6.88943 |
| NRF-1 | brain | 6.88105 |
| AP-4 | blood | 6.75447 |
| TATA | muscle | 6.73053 |
| HNF-1 | ovary | 6.60717 |
| ETF | larynx | 6.58903 |
| E47 | stomach | 6.41574 |
| ETF | blood | 6.41529 |
| E2F | lung | 6.32672 |
| MYOD | stomach | 6.32481 |
| EGR-3 | brain | 6.32344 |
| SP1 | stomach | 6.28951 |
| NF-Y | thymus | 6.28136 |
| TGIF | brain | 6.17949 |
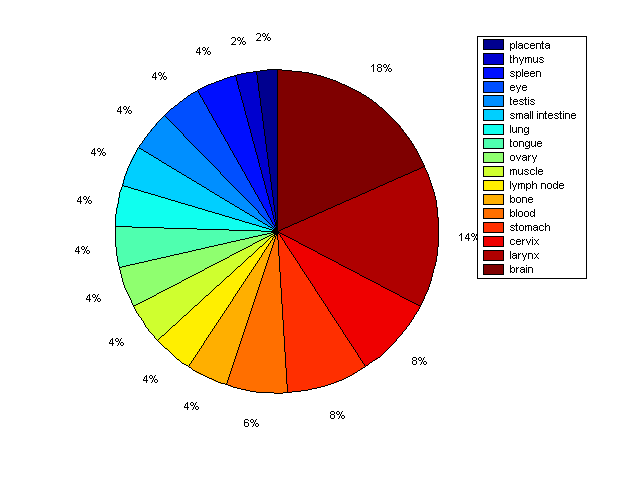
Distribution of Co-regulatory TFs
|
|
|
Description: this pie chart displays the distribution of co-regulatory transcription factors (TFs) in different tissues. Color schema: the tissue with the largest percentage of co-regulatory TFs is colored dark red whereas the tissue with the smallest percentage of co-regulatory TFs is colored dark blue. Tissues with intermediate percentages of co-regulatory TFs are colored from light red to yellow and cyan and then to light blue. |