Summary Table (Download Table)
| Co-regulatory TF | Tissue | -log(P) |
  | | |
| AREB6 | skin | 15.1089 |
| TATA | brain | 12.7449 |
| LMO2_COMPLEX | skin | 11.6641 |
| NF-1 | larynx | 9.83412 |
| ARP-1 | skin | 8.5302 |
| RSRFC4 | brain | 8.2423 |
| FREAC-3 | brain | 8.13697 |
| MEF-2 | larynx | 8.11999 |
| SMAD-3 | muscle | 8.09023 |
| LBP-1 | muscle | 7.8705 |
| NRF-1 | lymph_node | 7.712 |
| GATA-6 | heart | 7.51252 |
| GATA-1 | heart | 7.49386 |
| LHX3 | prostate | 7.40588 |
| CHX10 | larynx | 7.28991 |
| GATA-1 | larynx | 7.27922 |
| TAL-1ALPHA/E47 | muscle | 7.27019 |
| CDP_CR1 | brain | 7.17265 |
| FOXO1 | soft_tissue | 7.08959 |
| RP58 | placenta | 7.01654 |
| VDR | skin | 7.01529 |
| TBP | soft_tissue | 6.92206 |
| SRF | soft_tissue | 6.79976 |
| NF-Y | placenta | 6.73834 |
| HNF-1 | liver | 6.68448 |
| OCT-1 | brain | 6.68325 |
| AP-1 | muscle | 6.56589 |
| SRF | prostate | 6.54199 |
| TITF1 | kidney | 6.39004 |
| NKX6-2 | small_intestine | 6.35721 |
| MEF-2 | heart | 6.33031 |
| PAX-6 | small_intestine | 6.32614 |
| AP-1 | bone | 6.27502 |
| BACH2 | muscle | 6.2647 |
| DBP | small_intestine | 6.24785 |
| TCF11 | soft_tissue | 6.23314 |
| PAX-1 | placenta | 6.21658 |
| ETF | bone | 6.21058 |
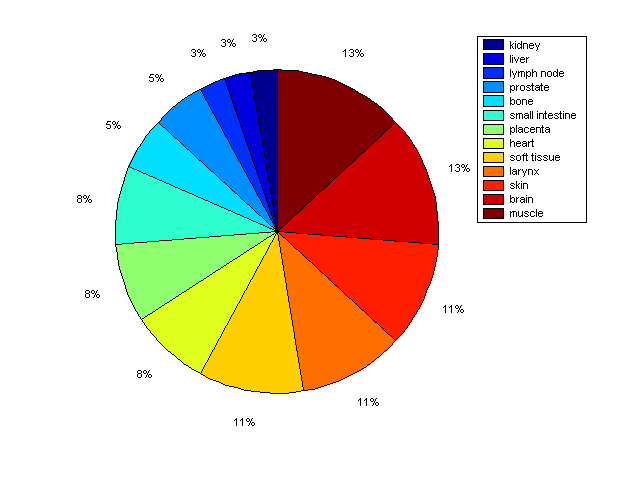
Distribution of Co-regulatory TFs
|
|
|
Description: this pie chart displays the distribution of co-regulatory transcription factors (TFs) in different tissues. Color schema: the tissue with the largest percentage of co-regulatory TFs is colored dark red whereas the tissue with the smallest percentage of co-regulatory TFs is colored dark blue. Tissues with intermediate percentages of co-regulatory TFs are colored from light red to yellow and cyan and then to light blue. |