Summary Table (Download Table)
| Co-regulatory TF | Tissue | -log(P) |
  | | |
| MEF-2 | heart | 14.6356 |
| SRF | heart | 13.3632 |
| C/EBP | muscle | 12.9067 |
| XBP-1 | muscle | 10.5903 |
| ARP-1 | muscle | 10.2648 |
| USF | muscle | 10.1853 |
| GR | muscle | 10.0425 |
| ETF | brain | 9.79826 |
| MTF-1 | brain | 9.70543 |
| PITX2 | muscle | 9.66399 |
| SREBP-1 | muscle | 9.43102 |
| TAL-1ALPHA/E47 | muscle | 8.65798 |
| COUP-TF/HNF-4 | kidney | 8.5388 |
| LXR | muscle | 8.4701 |
| CRX | prostate | 8.44445 |
| AP-1 | heart | 8.28112 |
| CRX | heart | 8.20313 |
| CRX | muscle | 8.06602 |
| TBP | muscle | 7.64935 |
| TAL-1BETA/ITF-2 | muscle | 7.56814 |
| STAT5B_(HOMODIMER) | heart | 7.48919 |
| GR | heart | 7.42096 |
| PAX-2 | muscle | 7.39432 |
| SMAD-4 | brain | 7.34964 |
| MEF-2 | larynx | 7.3255 |
| CDP | placenta | 7.28186 |
| FOXD3 | prostate | 7.15433 |
| LHX3 | placenta | 7.11119 |
| SP3 | muscle | 7.09478 |
| ARNT | muscle | 7.07557 |
| CDP_CR3+HD | muscle | 7.06441 |
| TATA | heart | 7.04141 |
| TST-1 | soft_tissue | 6.96259 |
| BACH2 | heart | 6.90888 |
| HNF-4ALPHA | muscle | 6.8973 |
| SRY | soft_tissue | 6.89665 |
| STAT6 | muscle | 6.8569 |
| HMG_IY | larynx | 6.84791 |
| ERR_ALPHA | eye | 6.78216 |
| C-MYC/MAX | muscle | 6.68939 |
| FOXO4 | heart | 6.67533 |
| MRF-2 | larynx | 6.65747 |
| STAT5A | heart | 6.60129 |
| CACCC-BINDING_FACTOR | brain | 6.56874 |
| CRX | kidney | 6.56585 |
| USF | heart | 6.51504 |
| TATA | peripheral_nervous_system | 6.44499 |
| STAT5A | muscle | 6.43369 |
| E12 | muscle | 6.43072 |
| SMAD-3 | brain | 6.42474 |
| MAZR | muscle | 6.41244 |
| TEF-1 | heart | 6.41157 |
| GATA-1 | brain | 6.39591 |
| CRE-BP1 | heart | 6.30719 |
| TAX/CREB | brain | 6.27499 |
| SOX-9 | eye | 6.19818 |
| AP-2GAMMA | brain | 6.17949 |
| C/EBPBETA | soft_tissue | 6.17291 |
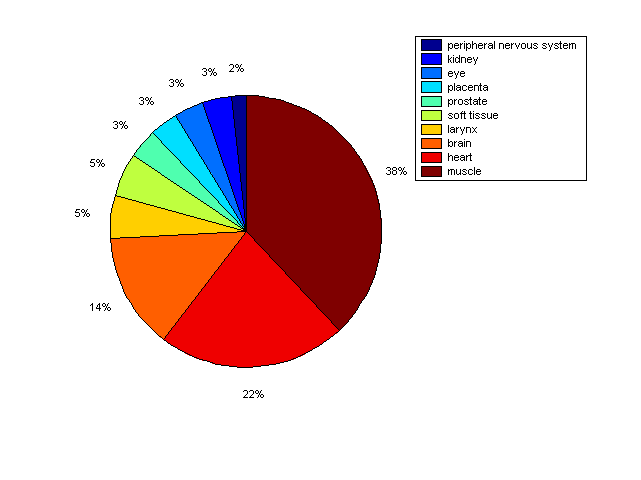
Distribution of Co-regulatory TFs
|
|
|
Description: this pie chart displays the distribution of co-regulatory transcription factors (TFs) in different tissues. Color schema: the tissue with the largest percentage of co-regulatory TFs is colored dark red whereas the tissue with the smallest percentage of co-regulatory TFs is colored dark blue. Tissues with intermediate percentages of co-regulatory TFs are colored from light red to yellow and cyan and then to light blue. |