Summary Table (Download Table)
| Co-regulatory TF | Tissue | -log(P) |
  | | |
| MEF-2 | muscle | 16.0298 |
| RSRFC4 | muscle | 14.1898 |
| HEB | muscle | 13.6493 |
| CRX | eye | 12.7791 |
| AP-1 | muscle | 11.6618 |
| FREAC-7 | brain | 11.2587 |
| HMG_IY | muscle | 10.9654 |
| TAL-1BETA/ITF-2 | muscle | 10.6216 |
| ATF | pancreas | 10.4295 |
| SRY | muscle | 10.3924 |
| MEF-2 | heart | 10.2825 |
| HNF-1 | kidney | 9.72782 |
| NKX6-2 | small_intestine | 9.07238 |
| ALPHA-CP1 | muscle | 8.91822 |
| TAL-1ALPHA/E47 | muscle | 8.69554 |
| VDR | skin | 8.57002 |
| MYOGENIN/NF-1 | muscle | 8.56415 |
| TATA | heart | 8.26291 |
| NF-E2 | muscle | 8.1699 |
| PITX2 | eye | 8.12741 |
| TAL-1BETA/ITF-2 | pancreas | 8.01771 |
| STAT5A | muscle | 7.97748 |
| SREBP-1 | muscle | 7.9737 |
| AP-1 | eye | 7.94013 |
| RREB-1 | muscle | 7.89793 |
| C/EBPDELTA | muscle | 7.5715 |
| PPARALPHA/RXR-ALPHA | muscle | 7.51719 |
| ATF | bone | 7.46248 |
| C-ETS-1 | skin | 7.3881 |
| GATA-1 | muscle | 7.30926 |
| FREAC-3 | brain | 7.30511 |
| ERR_ALPHA | muscle | 7.12067 |
| E12 | pancreas | 7.0442 |
| COUP-TF/HNF-4 | pancreas | 7.00615 |
| E2F | heart | 7.00068 |
| LMO2_COMPLEX | blood | 6.82961 |
| VDR | muscle | 6.77126 |
| AMEF-2 | heart | 6.69652 |
| LEF-1 | eye | 6.64169 |
| AP-2REP | muscle | 6.63417 |
| TATA | muscle | 6.60705 |
| GATA-1 | pancreas | 6.56683 |
| COUP-TF/HNF-4 | eye | 6.4969 |
| SRF | heart | 6.30843 |
| PITX2 | muscle | 6.24954 |
| GATA-1 | heart | 6.2356 |
| FOXO4 | eye | 6.20948 |
| ATF6 | skin | 6.17018 |
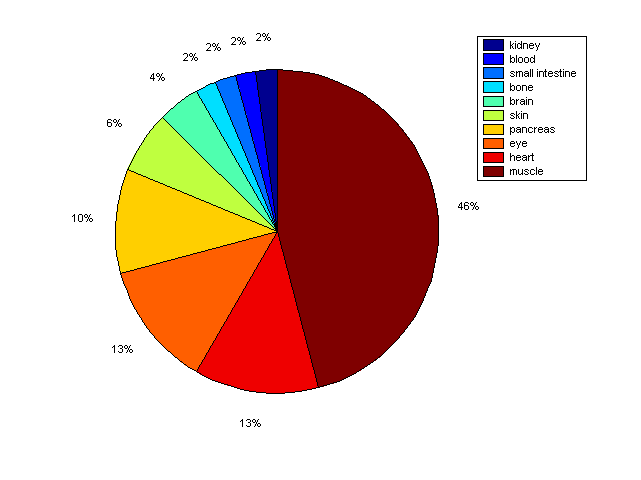
Distribution of Co-regulatory TFs
|
|
|
Description: this pie chart displays the distribution of co-regulatory transcription factors (TFs) in different tissues. Color schema: the tissue with the largest percentage of co-regulatory TFs is colored dark red whereas the tissue with the smallest percentage of co-regulatory TFs is colored dark blue. Tissues with intermediate percentages of co-regulatory TFs are colored from light red to yellow and cyan and then to light blue. |