Summary Table (Download Table)
| Co-regulatory TF | Tissue | -log(P) |
  | | |
| MEF-2 | muscle | 19.4743 |
| RSRFC4 | muscle | 17.9763 |
| MEF-2 | heart | 16.6384 |
| MEIS1 | muscle | 10.3384 |
| MEF-2 | larynx | 9.83003 |
| GATA-X | brain | 9.4508 |
| POU3F2 | small_intestine | 8.88556 |
| SREBP-1 | larynx | 8.58638 |
| TITF1 | small_intestine | 7.86357 |
| ATF3 | tongue | 7.67604 |
| NF-KAPPAB_(P65) | muscle | 7.21214 |
| PAX-1 | muscle | 7.17875 |
| RB/E2F-1/DP-1 | small_intestine | 7.08482 |
| PAX-6 | larynx | 7.06864 |
| TITF1 | larynx | 6.99606 |
| ATF | tongue | 6.97786 |
| C/EBPALPHA | brain | 6.87612 |
| MYOD | larynx | 6.811 |
| CREB | tongue | 6.73994 |
| GATA-1 | eye | 6.73801 |
| FREAC-3 | testis | 6.70041 |
| RFX1 | eye | 6.56499 |
| CHX10 | eye | 6.51605 |
| C/EBP | pancreas | 6.46482 |
| CRE-BP1 | tongue | 6.44896 |
| MEIS1 | larynx | 6.43366 |
| BRN-2 | muscle | 6.32811 |
| POU3F2 | muscle | 6.29951 |
| NCX | brain | 6.27275 |
| SRF | muscle | 6.26818 |
| FREAC-2 | testis | 6.24402 |
| CHX10 | larynx | 6.22687 |
| RSRFC4 | larynx | 6.19091 |
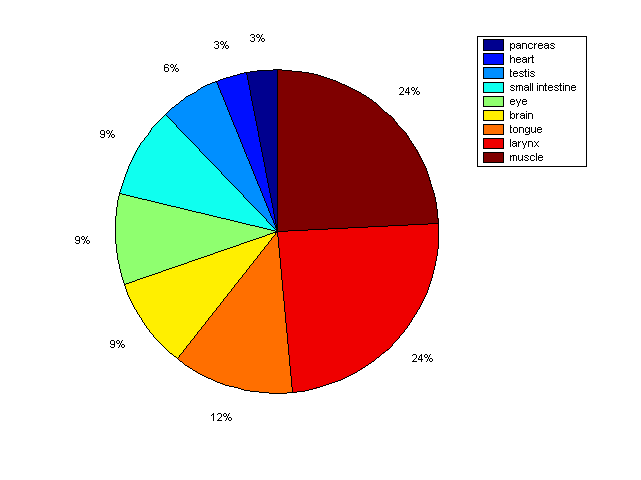
Distribution of Co-regulatory TFs
|
|
|
Description: this pie chart displays the distribution of co-regulatory transcription factors (TFs) in different tissues. Color schema: the tissue with the largest percentage of co-regulatory TFs is colored dark red whereas the tissue with the smallest percentage of co-regulatory TFs is colored dark blue. Tissues with intermediate percentages of co-regulatory TFs are colored from light red to yellow and cyan and then to light blue. |