Summary Table (Download Table)
| Co-regulatory TF | Tissue | -log(P) |
  | | |
| ELK-1 | small_intestine | 18.7921 |
| NRF-1 | testis | 17.8274 |
| ETF | larynx | 14.0964 |
| EGR-3 | testis | 11.2902 |
| NERF1A | spleen | 10.4357 |
| ETF | testis | 10.4292 |
| EGR-2 | testis | 10.3851 |
| C-MYC/MAX | pancreas | 10.2465 |
| ETF | cervix | 10.1263 |
| LBP-1 | spleen | 9.75718 |
| NRF-1 | larynx | 9.55435 |
| SP1 | tongue | 9.49377 |
| SREBP-1 | larynx | 8.76698 |
| ETF | blood | 8.06393 |
| ETF | brain | 7.79844 |
| NRF-1 | bladder | 7.75531 |
| TATA | thymus | 7.73464 |
| AP-2GAMMA | cervix | 7.69886 |
| MAZ | larynx | 7.65266 |
| MYOD | pancreas | 7.57452 |
| E2F-1/DP-1 | tongue | 7.5744 |
| P300 | tongue | 7.44162 |
| GABP | larynx | 7.34425 |
| ETF | stomach | 7.22354 |
| BSAP | tongue | 7.17201 |
| ETF | pancreas | 7.08157 |
| E2F-1 | blood | 7.04542 |
| USF | tongue | 7.0396 |
| HIF-1 | testis | 7.00475 |
| E2F | small_intestine | 6.98099 |
| LBP-1 | brain | 6.97994 |
| CACCC-BINDING_FACTOR | testis | 6.95775 |
| MAZ | brain | 6.94871 |
| AP-2 | thymus | 6.8277 |
| ETF | mammary_gland | 6.80112 |
| NRF-1 | cervix | 6.79585 |
| EGR-1 | testis | 6.79014 |
| MTF-1 | larynx | 6.60161 |
| CREB | thymus | 6.53889 |
| NF-Y | small_intestine | 6.53093 |
| EGR-2 | tongue | 6.52673 |
| MZF1 | pancreas | 6.46954 |
| EGR-3 | tongue | 6.45852 |
| AP-2 | testis | 6.42132 |
| E2F | cervix | 6.31968 |
| SRF | small_intestine | 6.31309 |
| YY1 | tongue | 6.24526 |
| TFII-I | brain | 6.23188 |
| E2F-1 | cervix | 6.16743 |
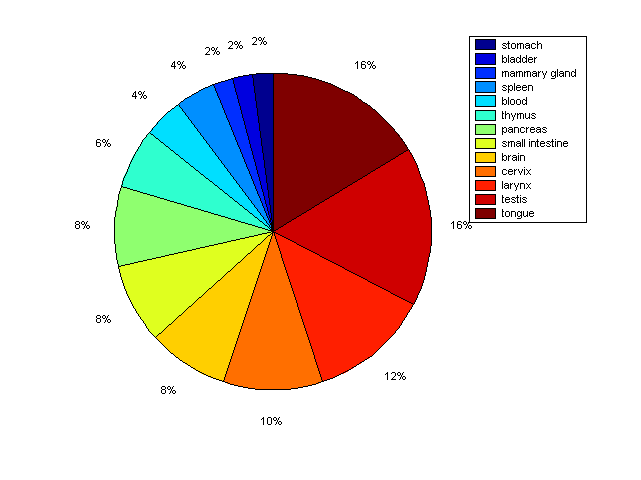
Distribution of Co-regulatory TFs
|
|
|
Description: this pie chart displays the distribution of co-regulatory transcription factors (TFs) in different tissues. Color schema: the tissue with the largest percentage of co-regulatory TFs is colored dark red whereas the tissue with the smallest percentage of co-regulatory TFs is colored dark blue. Tissues with intermediate percentages of co-regulatory TFs are colored from light red to yellow and cyan and then to light blue. |