Summary Table (Download Table)
| Co-regulatory TF | Tissue | -log(P) |
  | | |
| CHX10 | eye | 16.9589 |
| MEF-2 | muscle | 15.07 |
| C/EBP | brain | 13.6654 |
| CRX | eye | 12.929 |
| RSRFC4 | muscle | 12.0548 |
| MEF-2 | heart | 12.0005 |
| MEF-2 | larynx | 11.5344 |
| TCF-4 | brain | 11.1116 |
| FOXO1 | brain | 11.0473 |
| IRF1 | brain | 10.8869 |
| FOXO3 | brain | 9.9154 |
| RSRFC4 | heart | 9.83725 |
| ISRE | brain | 9.78564 |
| FOXO4 | brain | 9.77645 |
| RORALPHA2 | brain | 9.51118 |
| CDC5 | brain | 9.40926 |
| STAT6 | brain | 9.3649 |
| AREB6 | larynx | 9.36187 |
| FOXO1 | eye | 9.23655 |
| FOXJ2 | brain | 9.00329 |
| LHX3 | brain | 8.9968 |
| PITX2 | eye | 8.86426 |
| TEF | prostate | 8.68721 |
| TBP | prostate | 8.27949 |
| OCT-1 | heart | 8.18011 |
| BACH1 | eye | 8.15294 |
| FOXO4 | eye | 8.13924 |
| TAL-1BETA/ITF-2 | muscle | 8.10968 |
| RSRFC4 | testis | 8.09232 |
| ICSBP | brain | 8.07498 |
| TAL-1BETA/E47 | muscle | 7.97748 |
| TST-1 | heart | 7.83754 |
| LUN-1 | brain | 7.82865 |
| LBP-1 | soft_tissue | 7.80503 |
| GATA-X | heart | 7.74017 |
| USF | larynx | 7.55259 |
| POU3F2 | peripheral_nervous_system | 7.5476 |
| PEA3 | bone_marrow | 7.44406 |
| USF | muscle | 7.42282 |
| SRF | kidney | 7.39758 |
| MRF-2 | colon | 7.26784 |
| LMO2_COMPLEX | kidney | 7.21653 |
| HNF-6 | brain | 7.1634 |
| HNF-1 | colon | 7.16321 |
| HNF-1 | prostate | 7.09083 |
| NKX6-2 | eye | 7.07461 |
| PAX-2 | eye | 7.03321 |
| HNF-1 | small_intestine | 7.02308 |
| OCT-1 | eye | 6.96312 |
| SRY | muscle | 6.88148 |
| STAT1 | soft_tissue | 6.86123 |
| HNF-1 | eye | 6.76214 |
| TATA | lung | 6.75757 |
| MEIS1B/HOXA9 | brain | 6.69229 |
| TEF | testis | 6.69031 |
| SP1 | small_intestine | 6.68828 |
| POU1F1 | kidney | 6.68021 |
| OCT-1 | kidney | 6.62099 |
| PAX-2 | soft_tissue | 6.60696 |
| TGIF | heart | 6.60129 |
| SMAD-3 | eye | 6.5545 |
| PBX-1 | muscle | 6.50967 |
| BSAP | ovary | 6.50301 |
| STAT5A | brain | 6.4645 |
| TCF-4 | small_intestine | 6.45072 |
| PITX2 | skin | 6.43766 |
| TGIF | muscle | 6.43369 |
| AP-1 | eye | 6.42239 |
| OCT-1 | brain | 6.3949 |
| LUN-1 | mammary_gland | 6.38691 |
| MYOD | muscle | 6.34734 |
| SRY | colon | 6.3383 |
| SOX-9 | brain | 6.31456 |
| HNF-4 | brain | 6.27264 |
| MEIS1A/HOXA9 | small_intestine | 6.26297 |
| NF-Y | eye | 6.22743 |
| C/EBPALPHA | eye | 6.22598 |
| LHX3 | small_intestine | 6.21076 |
| CDC5 | muscle | 6.20834 |
| FOXO4 | larynx | 6.18529 |
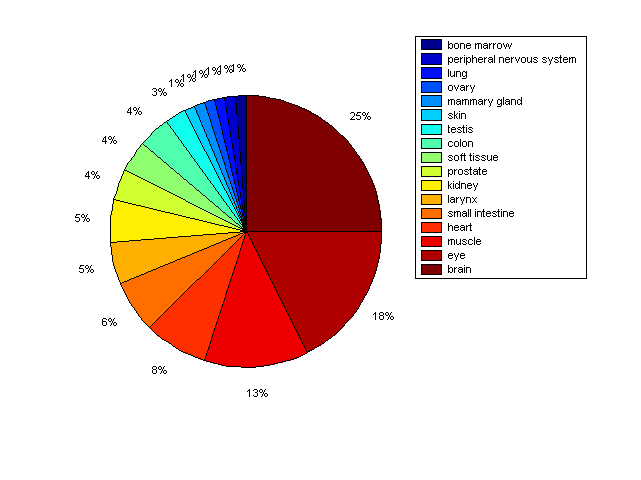
Distribution of Co-regulatory TFs
|
|
|
Description: this pie chart displays the distribution of co-regulatory transcription factors (TFs) in different tissues. Color schema: the tissue with the largest percentage of co-regulatory TFs is colored dark red whereas the tissue with the smallest percentage of co-regulatory TFs is colored dark blue. Tissues with intermediate percentages of co-regulatory TFs are colored from light red to yellow and cyan and then to light blue. |