Summary Table (Download Table)
| Co-regulatory TF | Tissue | -log(P) |
  | | |
| ATF | eye | 16.092 |
| ATF | pancreas | 15.4244 |
| ALPHA-CP1 | brain | 15.3938 |
| MEF-2 | muscle | 14.0643 |
| LF-A1 | brain | 12.3323 |
| SRF | heart | 12.0065 |
| NF-Y | brain | 11.1121 |
| SREBP-1 | brain | 10.7828 |
| RREB-1 | brain | 10.5979 |
| VDR | brain | 10.2812 |
| ATF-1 | pancreas | 10.1517 |
| CRE-BP1/C-JUN | eye | 9.92882 |
| GATA-1 | brain | 9.70834 |
| PU.1 | pancreas | 9.54697 |
| MIF-1 | skin | 9.46177 |
| CREB | eye | 9.17609 |
| P300 | brain | 8.93225 |
| CHX10 | small_intestine | 8.40024 |
| USF | small_intestine | 8.38907 |
| ATF-1 | eye | 8.31209 |
| LUN-1 | brain | 8.04336 |
| TFII-I | brain | 8.03573 |
| SRY | small_intestine | 8.03463 |
| CDP | brain | 8.00621 |
| E47 | pancreas | 7.89765 |
| WHN | small_intestine | 7.81963 |
| MEIS1 | muscle | 7.47042 |
| ATF3 | pancreas | 7.40663 |
| GATA-3 | brain | 7.2926 |
| ERR_ALPHA | muscle | 7.21999 |
| C-MYC/MAX | bone | 7.20381 |
| CREB | pancreas | 7.13768 |
| CACCC-BINDING_FACTOR | muscle | 7.13633 |
| AR | small_intestine | 7.06053 |
| HNF-1 | blood | 6.94247 |
| NRF-1 | lymph_node | 6.86829 |
| SP1 | pancreas | 6.75133 |
| TAX/CREB | skin | 6.72824 |
| PAX-1 | brain | 6.72573 |
| VDR | ovary | 6.71676 |
| CRE-BP1/C-JUN | pancreas | 6.67676 |
| NRSF | brain | 6.66898 |
| AREB6 | pancreas | 6.62414 |
| OCT-X | brain | 6.58634 |
| STAT1 | pancreas | 6.55212 |
| GATA-1 | eye | 6.45537 |
| LF-A1 | muscle | 6.44816 |
| E4F1 | eye | 6.44713 |
| ETF | lymph_node | 6.41683 |
| TAL-1BETA/ITF-2 | small_intestine | 6.39914 |
| GATA-4 | small_intestine | 6.39889 |
| OCT-1 | brain | 6.30843 |
| C-ETS-1 | brain | 6.16806 |
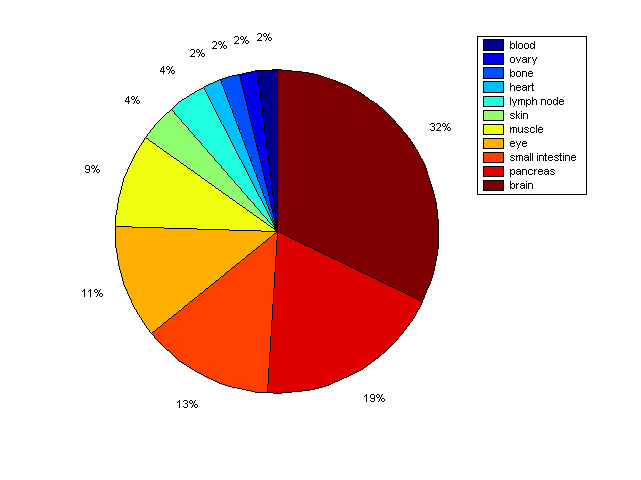
Distribution of Co-regulatory TFs
|
|
|
Description: this pie chart displays the distribution of co-regulatory transcription factors (TFs) in different tissues. Color schema: the tissue with the largest percentage of co-regulatory TFs is colored dark red whereas the tissue with the smallest percentage of co-regulatory TFs is colored dark blue. Tissues with intermediate percentages of co-regulatory TFs are colored from light red to yellow and cyan and then to light blue. |