Summary Table (Download Table)
| Co-regulatory TF | Tissue | -log(P) |
  | | |
| MIF-1 | brain | 17.9671 |
| GCM | brain | 17.4173 |
| MAZR | lung | 16.7819 |
| EGR-3 | brain | 16.0445 |
| AREB6 | brain | 15.6966 |
| EGR-2 | brain | 14.9571 |
| NF-AT | cervix | 13.8367 |
| EGR-1 | brain | 12.9888 |
| CHX10 | brain | 12.9287 |
| SREBP-1 | brain | 12.9242 |
| CHX10 | eye | 12.783 |
| PPARG | brain | 12.4033 |
| RFX1 | brain | 12.2166 |
| OCT-1 | brain | 11.8227 |
| C/EBP | cervix | 11.2989 |
| FOXO1 | soft_tissue | 10.6905 |
| SRF | brain | 10.5392 |
| E47 | brain | 10.2684 |
| SRF | muscle | 10.0989 |
| SMAD-3 | cervix | 9.90755 |
| MEF-2 | heart | 9.81821 |
| ARNT | brain | 9.17931 |
| WHN | brain | 8.78378 |
| SRY | brain | 8.63251 |
| FAC1 | brain | 8.60094 |
| ATF | cervix | 8.52008 |
| TAX/CREB | thymus | 8.47343 |
| ETF | thymus | 8.43971 |
| CDP | mammary_gland | 8.32647 |
| C-ETS-2 | soft_tissue | 8.14207 |
| C/EBP | brain | 8.12498 |
| TFIIA | muscle | 8.09023 |
| MEIS1B/HOXA9 | cervix | 8.07217 |
| PAX-2 | thymus | 8.04391 |
| HAND1/E47 | peripheral_nervous_system | 7.91138 |
| AP-2GAMMA | brain | 7.78427 |
| E4BP4 | brain | 7.7757 |
| NF-KAPPAB_(P50) | mammary_gland | 7.77522 |
| AHR/ARNT | mammary_gland | 7.77106 |
| PAX-8 | larynx | 7.64365 |
| CREB | cervix | 7.51454 |
| NF-Y | peripheral_nervous_system | 7.49487 |
| STAT6 | thymus | 7.37384 |
| ALPHA-CP1 | mammary_gland | 7.30136 |
| C/EBP | muscle | 7.29179 |
| STAT3 | thymus | 7.19702 |
| FOXJ2 | cervix | 7.01483 |
| AREB6 | cervix | 6.95311 |
| CHOP-C/EBPALPHA | cervix | 6.93047 |
| CRX | kidney | 6.87519 |
| NF-Y | cervix | 6.78514 |
| ERR_ALPHA | eye | 6.77011 |
| COUP-TF/HNF-4 | muscle | 6.69078 |
| PBX1B | eye | 6.65095 |
| ATF-1 | pancreas | 6.61714 |
| STAT5A | eye | 6.5545 |
| IRF-1 | brain | 6.54619 |
| RFX1 | pancreas | 6.51851 |
| TAL-1ALPHA/E47 | tongue | 6.49309 |
| PBX-1 | eye | 6.46497 |
| TST-1 | cervix | 6.45465 |
| TGIF | brain | 6.42474 |
| MAZR | muscle | 6.39221 |
| PAX-6 | brain | 6.36657 |
| GATA-6 | larynx | 6.35783 |
| LUN-1 | soft_tissue | 6.34717 |
| AREB6 | lung | 6.25967 |
| TEF-1 | heart | 6.24611 |
| PITX2 | skin | 6.20838 |
| RREB-1 | skin | 6.18327 |
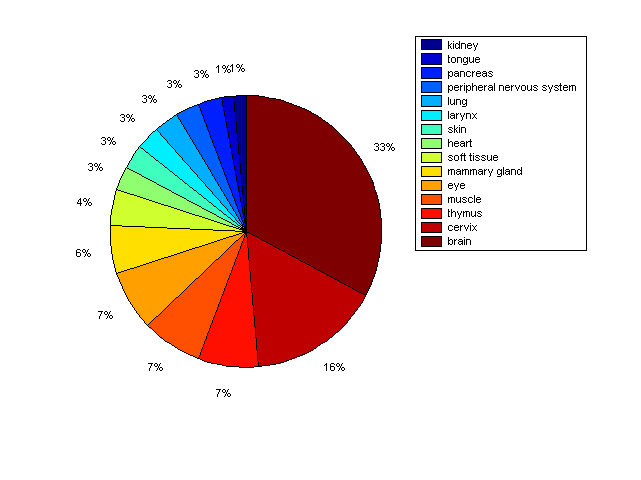
Distribution of Co-regulatory TFs
|
|
|
Description: this pie chart displays the distribution of co-regulatory transcription factors (TFs) in different tissues. Color schema: the tissue with the largest percentage of co-regulatory TFs is colored dark red whereas the tissue with the smallest percentage of co-regulatory TFs is colored dark blue. Tissues with intermediate percentages of co-regulatory TFs are colored from light red to yellow and cyan and then to light blue. |