Summary Table (Download Table)
| Co-regulatory TF | Tissue | -log(P) |
  | | |
| MEF-2 | muscle | 30.1964 |
| AREB6 | skin | 17.3264 |
| AMEF-2 | muscle | 15.7425 |
| GATA-2 | brain | 13.6716 |
| LMO2_COMPLEX | skin | 12.3281 |
| HNF-1 | liver | 12.2363 |
| HNF-1 | kidney | 11.5673 |
| MEIS1 | muscle | 11.4936 |
| SRF | muscle | 11.3155 |
| TATA | muscle | 10.7245 |
| TGIF | muscle | 10.2648 |
| FREAC-7 | brain | 10.2232 |
| MYOD | pancreas | 10.0973 |
| C-MYC/MAX | brain | 8.81172 |
| ZIC2 | cervix | 8.60102 |
| TFIIA | skin | 8.5302 |
| IPF1 | brain | 8.50603 |
| HNF-1 | colon | 8.38264 |
| COUP-TF/HNF-4 | eye | 8.2707 |
| TATA | heart | 8.12382 |
| MAX | eye | 8.03875 |
| CRX | kidney | 7.89052 |
| E12 | pancreas | 7.75503 |
| C/EBP | brain | 7.45644 |
| GATA-3 | brain | 7.24817 |
| GATA-1 | eye | 7.21042 |
| MYOD | brain | 7.16904 |
| AFP1 | kidney | 7.05675 |
| AP-3 | heart | 6.91535 |
| P300 | eye | 6.8881 |
| HNF-1 | muscle | 6.7977 |
| NERF1A | cervix | 6.77867 |
| MTF-1 | muscle | 6.69537 |
| COUP-TF/HNF-4 | kidney | 6.68594 |
| NKX3A | small_intestine | 6.67864 |
| ARP-1 | eye | 6.67096 |
| CDP | liver | 6.6417 |
| POU1F1 | brain | 6.59429 |
| NKX3A | colon | 6.44064 |
| TATA | small_intestine | 6.38451 |
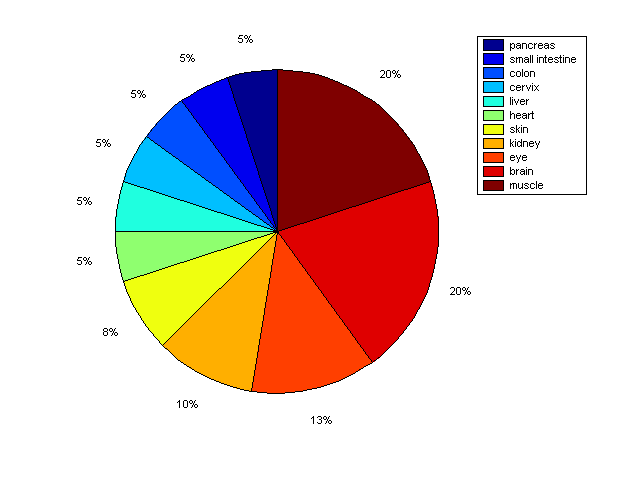
Distribution of Co-regulatory TFs
|
|
|
Description: this pie chart displays the distribution of co-regulatory transcription factors (TFs) in different tissues. Color schema: the tissue with the largest percentage of co-regulatory TFs is colored dark red whereas the tissue with the smallest percentage of co-regulatory TFs is colored dark blue. Tissues with intermediate percentages of co-regulatory TFs are colored from light red to yellow and cyan and then to light blue. |