Summary Table (Download Table)
| Co-regulatory TF | Tissue | -log(P) |
  | | |
| GATA-X | brain | 11.4855 |
| OCT-1 | testis | 9.41425 |
| LBP-1 | muscle | 9.19315 |
| HNF-1 | peripheral_nervous_system | 9.10634 |
| FOXJ2 | brain | 9.02825 |
| SRF | heart | 8.99714 |
| LHX3 | small_intestine | 8.9768 |
| OCT-1 | pancreas | 8.80383 |
| TATA | eye | 8.39371 |
| SRF | larynx | 7.96699 |
| TATA | brain | 7.66024 |
| HNF-6 | peripheral_nervous_system | 7.21509 |
| ICSBP | bone_marrow | 6.92647 |
| CDP | peripheral_nervous_system | 6.84917 |
| MYOD | muscle | 6.83633 |
| MEF-2 | muscle | 6.72322 |
| FAC1 | placenta | 6.69939 |
| C/EBP | pancreas | 6.68992 |
| MEF-2 | heart | 6.45122 |
| CDP_CR3 | muscle | 6.32811 |
| SRF | muscle | 6.22437 |
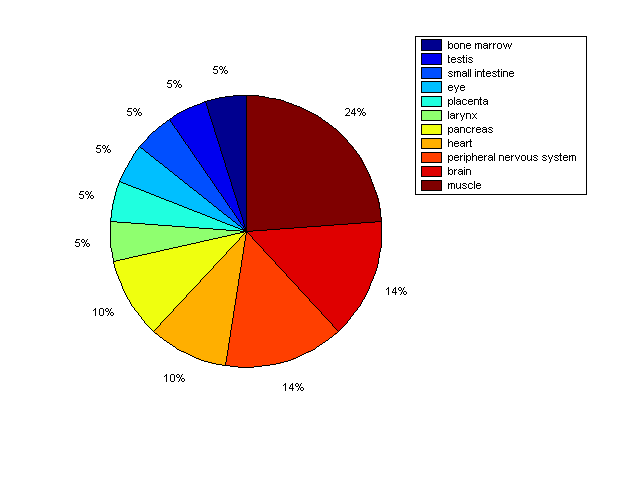
Distribution of Co-regulatory TFs
|
|
|
Description: this pie chart displays the distribution of co-regulatory transcription factors (TFs) in different tissues. Color schema: the tissue with the largest percentage of co-regulatory TFs is colored dark red whereas the tissue with the smallest percentage of co-regulatory TFs is colored dark blue. Tissues with intermediate percentages of co-regulatory TFs are colored from light red to yellow and cyan and then to light blue. |