Summary Table (Download Table)
| Co-regulatory TF | Tissue | -log(P) |
  | | |
| HNF-1 | kidney | 15.5567 |
| AMEF-2 | heart | 14.1574 |
| SRF | heart | 13.1628 |
| HNF-4 | kidney | 11.8699 |
| BRN-2 | brain | 11.4855 |
| HNF-4ALPHA | kidney | 11.3147 |
| NKX6-2 | small_intestine | 11.1467 |
| AP-1 | heart | 9.62168 |
| CDP_CR3 | brain | 9.4508 |
| GATA-1 | heart | 9.38028 |
| FOXD3 | brain | 8.96202 |
| XBP-1 | brain | 8.65622 |
| PITX2 | heart | 8.55411 |
| OCT-1 | brain | 8.48548 |
| TCF11/MAFG | brain | 8.35275 |
| HNF-1 | small_intestine | 8.30534 |
| ELK-1 | thymus | 8.29126 |
| RSRFC4 | spleen | 8.08074 |
| GATA-4 | brain | 7.8661 |
| POU3F2 | small_intestine | 7.74755 |
| STAT5A | heart | 7.74017 |
| CRE-BP1 | kidney | 7.48408 |
| GR | thymus | 7.37129 |
| NKX3A | small_intestine | 7.35076 |
| GR | heart | 7.20706 |
| NERF1A | thymus | 7.17769 |
| HSF2 | brain | 7.1766 |
| POU3F2 | kidney | 7.17599 |
| AR | heart | 7.13055 |
| ATF6 | brain | 7.12618 |
| MEF-2 | heart | 7.10585 |
| C-MYB | heart | 6.91521 |
| GR | bone_marrow | 6.86254 |
| RSRFC4 | mammary_gland | 6.80634 |
| FXR | heart | 6.7543 |
| STAT1 | kidney | 6.63833 |
| PU.1 | lymph_node | 6.63597 |
| AFP1 | heart | 6.60716 |
| CHX10 | kidney | 6.54944 |
| PAX-3 | brain | 6.53338 |
| SREBP-1 | testis | 6.49268 |
| PAX-8 | kidney | 6.49095 |
| RB/E2F-1/DP-1 | small_intestine | 6.40868 |
| LBP-1 | small_intestine | 6.36015 |
| HNF-3ALPHA | brain | 6.33481 |
| TAX/CREB | skin | 6.23781 |
| TITF1 | blood | 6.23637 |
| C/EBP | eye | 6.21698 |
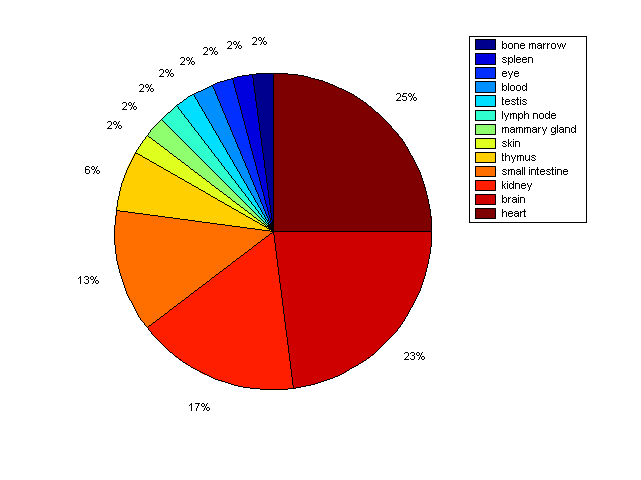
Distribution of Co-regulatory TFs
|
|
|
Description: this pie chart displays the distribution of co-regulatory transcription factors (TFs) in different tissues. Color schema: the tissue with the largest percentage of co-regulatory TFs is colored dark red whereas the tissue with the smallest percentage of co-regulatory TFs is colored dark blue. Tissues with intermediate percentages of co-regulatory TFs are colored from light red to yellow and cyan and then to light blue. |