Summary Table (Download Table)
| Co-regulatory TF | Tissue | -log(P) |
  | | |
| IPF1 | peripheral_nervous_system | 10.635 |
| NF-KAPPAB | tongue | 8.3592 |
| FOXJ2 | eye | 8.10908 |
| E2F | small_intestine | 8.03113 |
| SRF | peripheral_nervous_system | 7.4338 |
| C/EBPBETA | tongue | 7.33886 |
| NRF-1 | peripheral_nervous_system | 7.33749 |
| RFX1 | small_intestine | 7.23791 |
| NF-KAPPAB | spleen | 7.16695 |
| HFH-3 | peripheral_nervous_system | 6.71378 |
| PAX-1 | brain | 6.69294 |
| HMG_IY | soft_tissue | 6.56315 |
| LHX3 | brain | 6.48654 |
| LUN-1 | colon | 6.45007 |
| HAND1/E47 | skin | 6.27134 |
| OCT-1 | eye | 6.19249 |
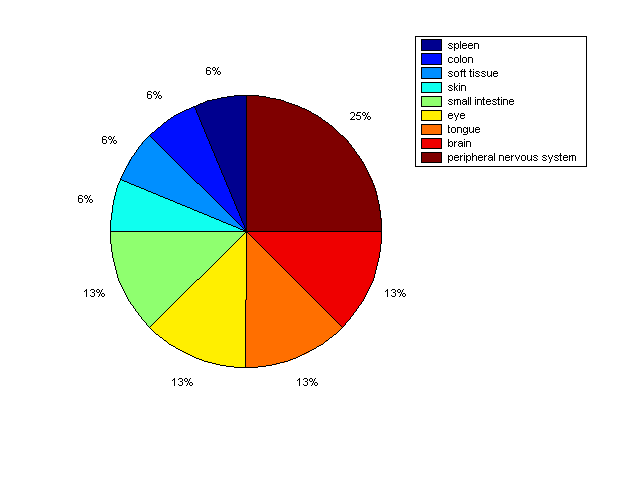
Distribution of Co-regulatory TFs
|
|
|
Description: this pie chart displays the distribution of co-regulatory transcription factors (TFs) in different tissues. Color schema: the tissue with the largest percentage of co-regulatory TFs is colored dark red whereas the tissue with the smallest percentage of co-regulatory TFs is colored dark blue. Tissues with intermediate percentages of co-regulatory TFs are colored from light red to yellow and cyan and then to light blue. |