Summary Table (Download Table)
| Co-regulatory TF | Tissue | -log(P) |
  | | |
| TAL-1BETA/E47 | muscle | 10.9654 |
| TAL-1BETA/ITF-2 | muscle | 10.8492 |
| E2F-4/DP-1 | small_intestine | 10.398 |
| HFH-4 | heart | 9.97115 |
| NKX6-1 | brain | 9.4558 |
| PAX-8 | larynx | 8.88029 |
| TEF-1 | small_intestine | 8.37002 |
| FREAC-3 | brain | 8.36116 |
| TCF11/MAFG | kidney | 8.28641 |
| E2F | small_intestine | 8.16905 |
| SRF | small_intestine | 8.05183 |
| USF | heart | 7.7438 |
| GATA-4 | small_intestine | 7.29958 |
| FOXO4 | heart | 7.2794 |
| HFH-3 | heart | 7.04684 |
| TST-1 | soft_tissue | 6.9851 |
| HNF-1 | liver | 6.95276 |
| NF-Y | peripheral_nervous_system | 6.94973 |
| TGIF | larynx | 6.84791 |
| IRF-1 | soft_tissue | 6.83465 |
| FREAC-7 | brain | 6.81494 |
| OSF2 | bone | 6.65446 |
| MRF-2 | small_intestine | 6.56665 |
| IRF-7 | soft_tissue | 6.56315 |
| TBP | muscle | 6.51118 |
| TATA | kidney | 6.47588 |
| CREB | kidney | 6.40847 |
| CACCC-BINDING_FACTOR | small_intestine | 6.28854 |
| PAX-6 | small_intestine | 6.26346 |
| HFH-3 | larynx | 6.24268 |
| TBP | larynx | 6.22158 |
| POU3F2 | lymph_node | 6.16096 |
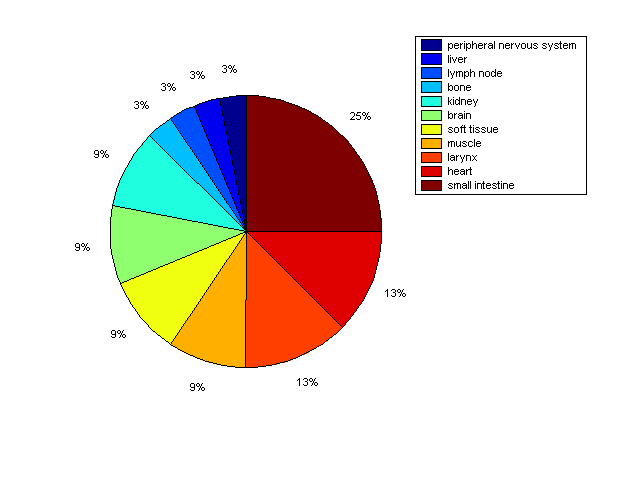
Distribution of Co-regulatory TFs
|
|
|
Description: this pie chart displays the distribution of co-regulatory transcription factors (TFs) in different tissues. Color schema: the tissue with the largest percentage of co-regulatory TFs is colored dark red whereas the tissue with the smallest percentage of co-regulatory TFs is colored dark blue. Tissues with intermediate percentages of co-regulatory TFs are colored from light red to yellow and cyan and then to light blue. |