Summary Table (Download Table)
| Co-regulatory TF | Tissue | -log(P) |
  | | |
| LBP-1 | soft_tissue | 16.8673 |
| CHX10 | brain | 14.1627 |
| AP-1 | muscle | 11.5777 |
| SRF | larynx | 10.4544 |
| MZF1 | brain | 10.1654 |
| PU.1 | soft_tissue | 10.1191 |
| SRF | small_intestine | 10.0542 |
| NF-KAPPAB | tongue | 9.91701 |
| SRF | muscle | 9.43907 |
| MYOD | soft_tissue | 9.33934 |
| AP-4 | soft_tissue | 9.2515 |
| MYOGENIN/NF-1 | soft_tissue | 9.03312 |
| AREB6 | spleen | 9.00739 |
| GABP | small_intestine | 8.8447 |
| FOXO1 | soft_tissue | 8.73847 |
| CHX10 | soft_tissue | 8.6268 |
| DBP | soft_tissue | 8.553 |
| GATA-4 | soft_tissue | 8.31143 |
| LXR | ovary | 8.19091 |
| ZID | small_intestine | 8.18712 |
| CREB | soft_tissue | 8.16066 |
| NRSF | brain | 8.04336 |
| STAT5A | brain | 7.82865 |
| AP-1 | heart | 7.64279 |
| WHN | small_intestine | 7.4128 |
| AP-4 | brain | 7.28554 |
| NF-E2 | bone | 7.13012 |
| OCT-1 | brain | 7.10062 |
| GATA-1 | soft_tissue | 7.04451 |
| BACH2 | muscle | 7.02683 |
| C/EBP | muscle | 6.83543 |
| MZF1 | soft_tissue | 6.79578 |
| TCF11 | soft_tissue | 6.7177 |
| RREB-1 | soft_tissue | 6.69129 |
| ALPHA-CP1 | small_intestine | 6.68339 |
| CRE-BP1 | small_intestine | 6.67906 |
| HSF | soft_tissue | 6.67625 |
| SRF | soft_tissue | 6.61047 |
| CRX | muscle | 6.56729 |
| GATA-1 | brain | 6.56541 |
| FOXO4 | soft_tissue | 6.54399 |
| ER | small_intestine | 6.46237 |
| IRF-7 | colon | 6.45007 |
| SMAD-4 | soft_tissue | 6.42595 |
| LBP-1 | larynx | 6.41671 |
| CACCC-BINDING_FACTOR | soft_tissue | 6.40235 |
| STAT5A | mammary_gland | 6.38691 |
| ZID | larynx | 6.36962 |
| STAT6 | mammary_gland | 6.35311 |
| IRF-1 | colon | 6.34815 |
| SMAD-3 | soft_tissue | 6.34717 |
| EGR-2 | soft_tissue | 6.34102 |
| CRX | eye | 6.30802 |
| TCF-4 | soft_tissue | 6.25524 |
| CRX | soft_tissue | 6.22788 |
| NERF1A | soft_tissue | 6.19988 |
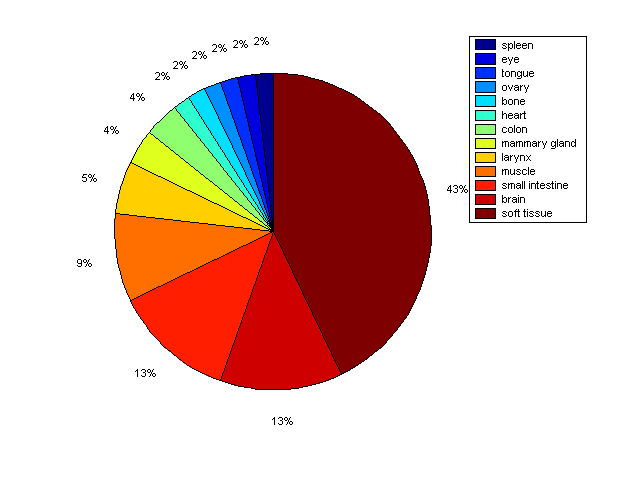
Distribution of Co-regulatory TFs
|
|
|
Description: this pie chart displays the distribution of co-regulatory transcription factors (TFs) in different tissues. Color schema: the tissue with the largest percentage of co-regulatory TFs is colored dark red whereas the tissue with the smallest percentage of co-regulatory TFs is colored dark blue. Tissues with intermediate percentages of co-regulatory TFs are colored from light red to yellow and cyan and then to light blue. |