Summary Table (Download Table)
| Co-regulatory TF | Tissue | -log(P) |
  | | |
| OCT-1 | bone | 27.0746 |
| POU3F2 | uterus | 14.3834 |
| E4BP4 | uterus | 12.1305 |
| SRF | heart | 11.1706 |
| MEF-2 | muscle | 10.0325 |
| HFH-3 | peripheral_nervous_system | 9.8747 |
| TBP | bone_marrow | 9.57736 |
| NRF-1 | small_intestine | 9.28784 |
| C/EBP | bone | 9.12675 |
| NKX6-1 | uterus | 8.95362 |
| NF-1 | brain | 8.32014 |
| HNF-3ALPHA | peripheral_nervous_system | 8.24517 |
| E47 | kidney | 8.11325 |
| POU3F2 | peripheral_nervous_system | 7.98685 |
| FOXJ2 | peripheral_nervous_system | 7.89984 |
| HNF-3ALPHA | bone | 7.87314 |
| POU3F2 | prostate | 7.7887 |
| FOXO1 | peripheral_nervous_system | 7.74269 |
| USF2 | muscle | 7.62366 |
| NKX6-2 | peripheral_nervous_system | 7.59163 |
| OCT-X | bone | 7.39811 |
| OCT-1 | kidney | 7.15856 |
| USF | muscle | 7.07864 |
| HNF-6 | kidney | 7.0256 |
| YY1 | peripheral_nervous_system | 6.97573 |
| NKX6-2 | uterus | 6.89292 |
| GR | liver | 6.84486 |
| ARNT | muscle | 6.82011 |
| FOXO1 | uterus | 6.7776 |
| MAX | muscle | 6.74543 |
| GATA-1 | heart | 6.74534 |
| LHX3 | small_intestine | 6.68445 |
| STAT5A | kidney | 6.68021 |
| ARP-1 | brain | 6.59429 |
| FREAC-7 | bone | 6.48288 |
| RSRFC4 | muscle | 6.46269 |
| ELF-1 | bone | 6.45211 |
| C-MYB | peripheral_nervous_system | 6.38773 |
| GCNF | mammary_gland | 6.29005 |
| FOXJ2 | bone | 6.27815 |
| HNF-1 | small_intestine | 6.25831 |
| MEIS1 | pancreas | 6.25657 |
| OCT-1 | small_intestine | 6.25444 |
| E4F1 | bone | 6.23781 |
| SREBP-1 | muscle | 6.1966 |
| FOXO4 | peripheral_nervous_system | 6.19584 |
| MRF-2 | small_intestine | 6.19167 |
| FREAC-7 | peripheral_nervous_system | 6.17247 |
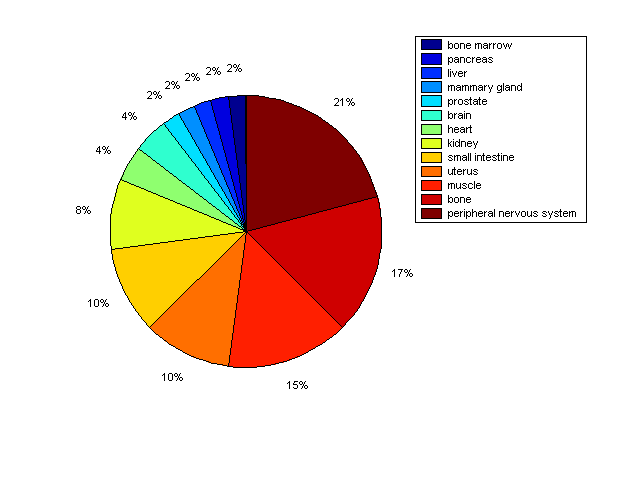
Distribution of Co-regulatory TFs
|
|
|
Description: this pie chart displays the distribution of co-regulatory transcription factors (TFs) in different tissues. Color schema: the tissue with the largest percentage of co-regulatory TFs is colored dark red whereas the tissue with the smallest percentage of co-regulatory TFs is colored dark blue. Tissues with intermediate percentages of co-regulatory TFs are colored from light red to yellow and cyan and then to light blue. |