Summary Table (Download Table)
| Co-regulatory TF | Tissue | -log(P) |
  | | |
| GCNF | mammary_gland | 13.4416 |
| LHX3 | placenta | 13.3207 |
| YY1 | heart | 11.1963 |
| SOX-9 | brain | 10.9367 |
| CDP | peripheral_nervous_system | 10.713 |
| ISRE | lymph_node | 10.4902 |
| HNF-1 | peripheral_nervous_system | 10.0647 |
| AHR/ARNT | tongue | 9.77539 |
| IRF1 | lymph_node | 9.49832 |
| SRY | peripheral_nervous_system | 9.40174 |
| OCT-1 | pancreas | 9.29211 |
| NF-Y | peripheral_nervous_system | 9.15101 |
| SMAD-3 | brain | 8.60094 |
| PU.1 | lymph_node | 8.33999 |
| PEA3 | mammary_gland | 8.30564 |
| GATA-1 | mammary_gland | 8.2781 |
| AP-1 | larynx | 8.26435 |
| LMO2_COMPLEX | tongue | 8.0321 |
| NKX6-1 | peripheral_nervous_system | 7.78074 |
| ATF-1 | tongue | 7.77259 |
| PAX-6 | mammary_gland | 7.62381 |
| PITX2 | lymph_node | 7.61051 |
| PITX2 | skin | 7.55603 |
| GATA-6 | peripheral_nervous_system | 7.53735 |
| XBP-1 | tongue | 7.48561 |
| SRF | pancreas | 7.4837 |
| RP58 | bone_marrow | 7.34428 |
| AP-1 | tongue | 7.3398 |
| HNF-3ALPHA | peripheral_nervous_system | 7.31623 |
| OCT-1 | brain | 7.29323 |
| C/EBPDELTA | lymph_node | 7.27989 |
| TEF-1 | small_intestine | 7.25847 |
| AHR/ARNT | mammary_gland | 7.22654 |
| BACH2 | larynx | 7.18234 |
| TEF | brain | 7.14399 |
| TST-1 | soft_tissue | 7.088 |
| MEF-2 | larynx | 7.06497 |
| STAT6 | mammary_gland | 7.05084 |
| ETF | mammary_gland | 7.04303 |
| CDP | placenta | 7.03414 |
| C-ETS-1 | thymus | 6.97773 |
| OCT-1 | tongue | 6.97073 |
| GCNF | peripheral_nervous_system | 6.92638 |
| FAC1 | mammary_gland | 6.92457 |
| TBP | heart | 6.80258 |
| CRX | eye | 6.77859 |
| RFX1 | tongue | 6.76233 |
| BRN-2 | placenta | 6.69939 |
| C-REL | ovary | 6.68595 |
| FOXJ2 | placenta | 6.68501 |
| LXR | brain | 6.65712 |
| NF-KAPPAB_(P65) | ovary | 6.62861 |
| SRY | bone_marrow | 6.62659 |
| HFH-4 | peripheral_nervous_system | 6.62141 |
| MEIS1A/HOXA9 | mammary_gland | 6.59793 |
| GATA-1 | tongue | 6.57957 |
| AMEF-2 | eye | 6.57658 |
| ATF-1 | bladder | 6.55097 |
| AP-1 | mammary_gland | 6.50488 |
| STAT6 | heart | 6.49065 |
| CDP_CR3+HD | brain | 6.47318 |
| C/EBP | brain | 6.45305 |
| TATA | pancreas | 6.39131 |
| RP58 | peripheral_nervous_system | 6.3619 |
| ERR_ALPHA | brain | 6.3273 |
| PAX-2 | tongue | 6.31268 |
| NF-E2 | tongue | 6.30343 |
| MRF-2 | mammary_gland | 6.25993 |
| AREB6 | small_intestine | 6.18164 |
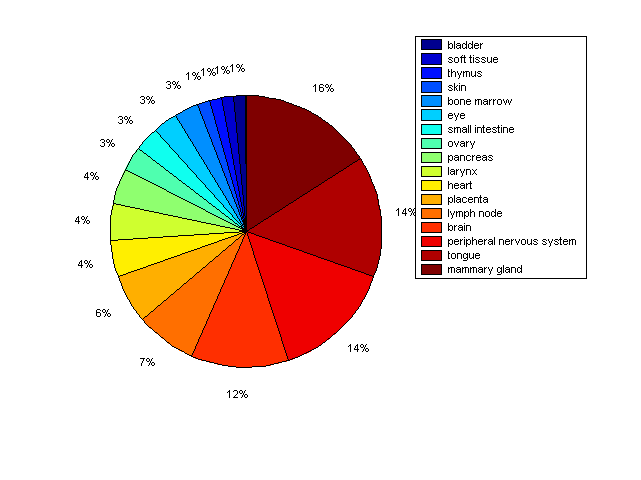
Distribution of Co-regulatory TFs
|
|
|
Description: this pie chart displays the distribution of co-regulatory transcription factors (TFs) in different tissues. Color schema: the tissue with the largest percentage of co-regulatory TFs is colored dark red whereas the tissue with the smallest percentage of co-regulatory TFs is colored dark blue. Tissues with intermediate percentages of co-regulatory TFs are colored from light red to yellow and cyan and then to light blue. |