Summary Table (Download Table)
| Co-regulatory TF | Tissue | -log(P) |
  |   |   |
| POU3F2 | heart | 14.7902 |
| POU3F2 | small_intestine | 13.5347 |
| GATA-6 | heart | 13.1595 |
| STAT5A | brain | 10.8869 |
| HNF-1 | colon | 10.1854 |
| AP-1 | heart | 10.1501 |
| FAC1 | lymph_node | 9.49832 |
| MRF-2 | colon | 8.81624 |
| CDP | colon | 8.68698 |
| NRF-1 | small_intestine | 8.64312 |
| CDC5 | heart | 8.62644 |
| ELF-1 | soft_tissue | 8.31566 |
| AFP1 | colon | 8.05242 |
| FOXO3 | heart | 8.00954 |
| GR | heart | 7.87154 |
| FOXJ2 | heart | 7.62364 |
| PAX-2 | small_intestine | 7.62101 |
| FOXJ2 | colon | 7.61362 |
| TEF | heart | 7.57834 |
| GCM | bladder | 7.26008 |
| PAX-8 | small_intestine | 7.25896 |
| GATA-1 | larynx | 7.09741 |
| OCT-1 | brain | 6.77222 |
| ICSBP | soft_tissue | 6.59567 |
| ICSBP | heart | 6.52748 |
| AREB6 | larynx | 6.47041 |
| HNF-1 | liver | 6.44464 |
| PAX-6 | small_intestine | 6.38511 |
| C/EBP | bone | 6.28904 |
| MEF-2 | small_intestine | 6.28641 |
| E2F | thymus | 6.2741 |
| SRF | muscle | 6.19996 |
| OCT-X | heart | 6.16261 |
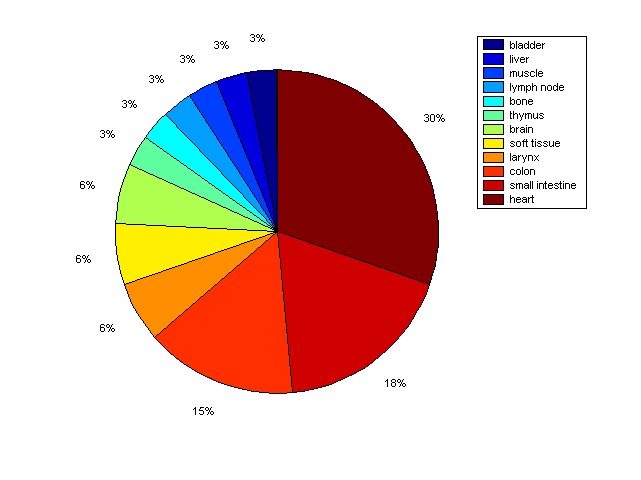
Distribution of Co-regulatory TFs
|
|
|
Description: this pie chart displays the distribution of co-regulatory transcription factors (TFs) in different tissues. Color schema: the tissue with the largest percentage of co-regulatory TFs is colored dark red whereas the tissue with the smallest percentage of co-regulatory TFs is colored dark blue. Tissues with intermediate percentages of co-regulatory TFs are colored from light red to yellow and cyan and then to light blue. |
