Summary Table (Download Table)
| Co-regulatory TF | Tissue | -log(P) |
  | | |
| MEF-2 | muscle | 14.5961 |
| C/EBPBETA | muscle | 14.5253 |
| RSRFC4 | muscle | 12.467 |
| NKX6-2 | small_intestine | 11.6518 |
| SRF | soft_tissue | 9.71006 |
| CHX10 | small_intestine | 9.43993 |
| LMO2_COMPLEX | brain | 9.21287 |
| AR | small_intestine | 9.20053 |
| PPAR | small_intestine | 8.74106 |
| HNF-4 | kidney | 8.56557 |
| AREB6 | brain | 8.40338 |
| TCF-4 | thymus | 8.33208 |
| LUN-1 | soft_tissue | 8.31143 |
| FOXO1 | small_intestine | 7.93322 |
| GATA-X | brain | 7.8661 |
| IRF-1 | small_intestine | 7.65818 |
| GATA-1 | brain | 7.61643 |
| HNF-1 | kidney | 7.48662 |
| RB/E2F-1/DP-1 | small_intestine | 7.41667 |
| MAX | larynx | 7.38506 |
| HMG_IY | small_intestine | 7.29958 |
| ERR_ALPHA | brain | 7.20121 |
| MIF-1 | small_intestine | 7.10014 |
| C/EBP | muscle | 6.92628 |
| STAT1 | small_intestine | 6.91486 |
| HSF1 | small_intestine | 6.91175 |
| HNF-1 | small_intestine | 6.89379 |
| LBP-1 | spleen | 6.87526 |
| NF-1 | larynx | 6.87525 |
| CHX10 | muscle | 6.8453 |
| PAX-8 | small_intestine | 6.82157 |
| PAX-6 | small_intestine | 6.6955 |
| E2F-1 | small_intestine | 6.60472 |
| HOXA4 | small_intestine | 6.51592 |
| C-ETS-1 | colon | 6.50103 |
| TATA | stomach | 6.47079 |
| YY1 | thymus | 6.46389 |
| NRSF | small_intestine | 6.39889 |
| PU.1 | small_intestine | 6.38605 |
| PAX-3 | muscle | 6.30585 |
| CRE-BP1/C-JUN | small_intestine | 6.3049 |
| SRF | small_intestine | 6.2396 |
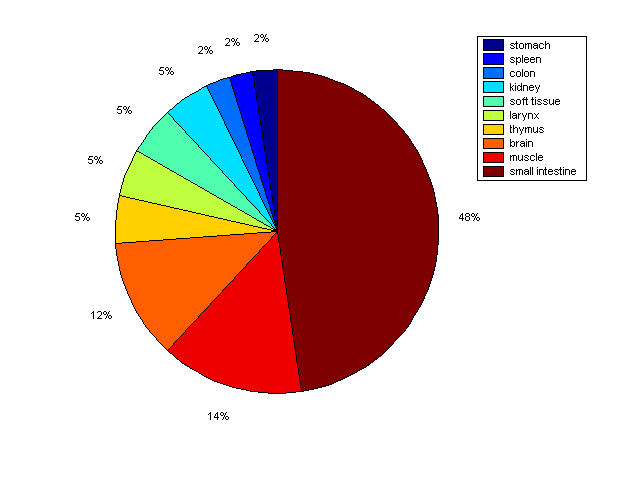
Distribution of Co-regulatory TFs
|
|
|
Description: this pie chart displays the distribution of co-regulatory transcription factors (TFs) in different tissues. Color schema: the tissue with the largest percentage of co-regulatory TFs is colored dark red whereas the tissue with the smallest percentage of co-regulatory TFs is colored dark blue. Tissues with intermediate percentages of co-regulatory TFs are colored from light red to yellow and cyan and then to light blue. |