Summary Table (Download Table)
| Co-regulatory TF | Tissue | -log(P) |
  | | |
| ETF | tongue | 23.4409 |
| NRF-1 | testis | 17.1119 |
| SRF | soft_tissue | 16.9948 |
| ELK-1 | larynx | 12.5907 |
| NRF-1 | larynx | 12.4742 |
| ETF | bone | 12.3574 |
| HEB | testis | 12.3069 |
| STATX | ovary | 11.9379 |
| MZF1 | ovary | 11.7402 |
| CREB | tongue | 11.5384 |
| NRF-1 | tongue | 11.4253 |
| NF-Y | tongue | 11.1997 |
| MAZ | ovary | 11.134 |
| ETF | larynx | 10.962 |
| MAZR | soft_tissue | 10.7468 |
| RSRFC4 | soft_tissue | 10.6278 |
| E2F-4/DP-1 | tongue | 10.5081 |
| ETF | testis | 10.5033 |
| NRF-1 | blood | 10.4733 |
| E2F | tongue | 10.3601 |
| SP1 | cervix | 10.2434 |
| E2F-1 | testis | 9.89628 |
| RSRFC4 | peripheral_nervous_system | 9.89431 |
| ETF | lymph_node | 9.8664 |
| GABP | larynx | 9.85192 |
| CREB | peripheral_nervous_system | 9.74149 |
| E4F1 | larynx | 9.51373 |
| AP-2 | tongue | 9.49377 |
| AREB6 | pancreas | 9.48468 |
| ETF | stomach | 9.39519 |
| STAT3 | small_intestine | 9.36114 |
| SP1 | larynx | 9.32576 |
| C-MYC/MAX | testis | 9.28333 |
| MYOD | pancreas | 9.25244 |
| MEF-2 | soft_tissue | 8.92787 |
| SP1 | small_intestine | 8.90303 |
| MIF-1 | testis | 8.89502 |
| USF | bone_marrow | 8.89326 |
| NF-Y | blood | 8.84819 |
| HEB | pancreas | 8.83094 |
| E2F | testis | 8.83013 |
| NRF-1 | cervix | 8.77837 |
| E2F | small_intestine | 8.73083 |
| SP1 | pancreas | 8.65671 |
| USF | small_intestine | 8.3992 |
| ATF6 | larynx | 8.26696 |
| RB/E2F-1/DP-1 | testis | 8.25803 |
| CREB | soft_tissue | 8.23999 |
| SRF | peripheral_nervous_system | 8.22054 |
| E2F-4/DP-1 | testis | 8.19444 |
| RB/E2F-1/DP-1 | tongue | 8.14811 |
| E47 | pancreas | 8.13807 |
| E12 | pancreas | 8.0629 |
| NRF-1 | bladder | 7.93237 |
| ATF4 | larynx | 7.89104 |
| TAL-1ALPHA/E47 | small_intestine | 7.85142 |
| SP1 | soft_tissue | 7.78184 |
| AP-2GAMMA | testis | 7.68632 |
| NRF-1 | soft_tissue | 7.63703 |
| SP1 | muscle | 7.61436 |
| USF | testis | 7.60996 |
| MTF-1 | soft_tissue | 7.60378 |
| TATA | bone | 7.59794 |
| AP-4 | pancreas | 7.57475 |
| SP3 | lymph_node | 7.54716 |
| E2F-4/DP-2 | testis | 7.47685 |
| AP-4 | lymph_node | 7.45745 |
| AP-4 | brain | 7.38751 |
| ARNT | testis | 7.29485 |
| E47 | ovary | 7.293 |
| LBP-1 | lymph_node | 7.28921 |
| E2F-1 | tongue | 7.23442 |
| NRF-1 | kidney | 7.23336 |
| GR | testis | 7.17291 |
| FOXO1 | thymus | 7.16358 |
| AP-2GAMMA | small_intestine | 7.15669 |
| AREB6 | ovary | 7.10075 |
| C-MYC/MAX | stomach | 7.07447 |
| MAZR | cervix | 7.074 |
| MEF-2 | peripheral_nervous_system | 7.04011 |
| USF2 | testis | 7.0232 |
| NF-Y | testis | 6.9968 |
| HIF-1 | testis | 6.96395 |
| STAT1 | brain | 6.89547 |
| SP1 | testis | 6.88073 |
| AP-2ALPHA | small_intestine | 6.87766 |
| SF-1 | small_intestine | 6.87662 |
| GABP | tongue | 6.86321 |
| CRE-BP1 | tongue | 6.84421 |
| LMO2_COMPLEX | ovary | 6.83381 |
| SREBP-1 | testis | 6.8281 |
| MAZR | small_intestine | 6.80085 |
| EGR-3 | testis | 6.80057 |
| RFX1 | testis | 6.78585 |
| MIF-1 | larynx | 6.76983 |
| NRSF | pancreas | 6.75133 |
| STAT3 | ovary | 6.73247 |
| ETF | thymus | 6.70779 |
| E2F-1/DP-1 | testis | 6.69741 |
| STAT5A | small_intestine | 6.68828 |
| LMO2_COMPLEX | kidney | 6.63272 |
| TEL-2 | larynx | 6.62078 |
| CREB | larynx | 6.61803 |
| E4F1 | soft_tissue | 6.5492 |
| ETF | kidney | 6.53938 |
| ATF | tongue | 6.53433 |
| MYOD | small_intestine | 6.43451 |
| E2F-1 | blood | 6.43246 |
| WHN | testis | 6.42738 |
| AREB6 | brain | 6.37107 |
| PAX-1 | brain | 6.3645 |
| NRF-1 | stomach | 6.35999 |
| YY1 | tongue | 6.35973 |
| CDC5 | brain | 6.31319 |
| NF-MUE1 | larynx | 6.31013 |
| AP-2GAMMA | stomach | 6.28951 |
| OCT-1 | brain | 6.27468 |
| CRE-BP1 | larynx | 6.27348 |
| USF | tongue | 6.25755 |
| NF-E2 | small_intestine | 6.24181 |
| NF-Y | larynx | 6.22564 |
| SP3 | kidney | 6.21728 |
| SP1 | stomach | 6.20743 |
| AHR/ARNT | pancreas | 6.17993 |
| STAT5A_(HOMODIMER) | ovary | 6.17637 |
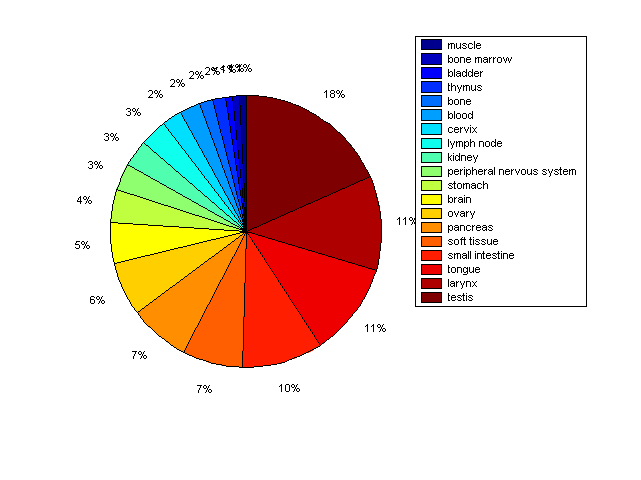
Distribution of Co-regulatory TFs
|
|
|
Description: this pie chart displays the distribution of co-regulatory transcription factors (TFs) in different tissues. Color schema: the tissue with the largest percentage of co-regulatory TFs is colored dark red whereas the tissue with the smallest percentage of co-regulatory TFs is colored dark blue. Tissues with intermediate percentages of co-regulatory TFs are colored from light red to yellow and cyan and then to light blue. |