Summary Table (Download Table)
| Co-regulatory TF | Tissue | -log(P) |
  | | |
| AREB6 | skin | 47.5044 |
| MIF-1 | bone | 18.5198 |
| E2F-1 | tongue | 15.6264 |
| RFX1 | bone | 15.0928 |
| E47 | skin | 13.9248 |
| LMO2_COMPLEX | skin | 13.7107 |
| GATA-6 | heart | 13.6134 |
| EF-C | bone | 13.0551 |
| ARP-1 | skin | 12.3281 |
| TFIIA | skin | 11.6641 |
| NRF-1 | lung | 10.5386 |
| GATA-1 | heart | 9.87205 |
| XBP-1 | brain | 9.27243 |
| GATA-4 | brain | 9.21287 |
| E2F-1/DP-1 | tongue | 9.09276 |
| CART-1 | kidney | 9.04321 |
| LBP-1 | bone | 9.03803 |
| HEB | heart | 8.98146 |
| MEF-2 | heart | 8.59378 |
| SF-1 | kidney | 8.45263 |
| RSRFC4 | heart | 8.33669 |
| ALPHA-CP1 | eye | 8.31436 |
| AP-4 | spleen | 8.18664 |
| RB/E2F-1/DP-1 | tongue | 8.1538 |
| SMAD-4 | brain | 8.14417 |
| VDR | skin | 8.09632 |
| FAC1 | tongue | 8.0321 |
| EGR-3 | blood | 7.91715 |
| FREAC-7 | lung | 7.87236 |
| AP-4 | bone | 7.77203 |
| RREB-1 | larynx | 7.7363 |
| LEF-1 | brain | 7.57357 |
| MEF-2 | eye | 7.43306 |
| FREAC-2 | kidney | 7.35995 |
| OCT-X | lymph_node | 7.35983 |
| E2F-1/DP-2 | tongue | 7.32726 |
| STAT5A | kidney | 7.21653 |
| C-ETS-1 | spleen | 7.21445 |
| HIF-1 | bone | 7.19987 |
| ATF | placenta | 7.19194 |
| HAND1/E47 | colon | 6.94289 |
| IRF-1 | tongue | 6.89743 |
| SP1 | ovary | 6.83381 |
| TEF-1 | small_intestine | 6.83161 |
| TAL-1BETA/E47 | blood | 6.82961 |
| PEA3 | lymph_node | 6.81853 |
| MYOD | skin | 6.79786 |
| GATA-1 | tongue | 6.76922 |
| ZID | kidney | 6.76625 |
| NRF-1 | small_intestine | 6.76209 |
| E12 | brain | 6.70157 |
| BACH2 | heart | 6.67474 |
| NF-KAPPAB | brain | 6.67167 |
| GATA-1 | liver | 6.65199 |
| SP1 | kidney | 6.63272 |
| LBP-1 | muscle | 6.61611 |
| TATA | heart | 6.58705 |
| ETF | lung | 6.56679 |
| SRY | heart | 6.51869 |
| AP-1 | heart | 6.49555 |
| C/EBPBETA | liver | 6.47625 |
| E2F-4/DP-2 | tongue | 6.44623 |
| NF-Y | blood | 6.42845 |
| AREB6 | ovary | 6.41493 |
| TAL-1ALPHA/E47 | blood | 6.39026 |
| CDP | heart | 6.37965 |
| AP-1 | prostate | 6.33514 |
| PAX-2 | heart | 6.30145 |
| STAT4 | eye | 6.29032 |
| CREB | blood | 6.27866 |
| SREBP-1 | bladder | 6.27574 |
| CACCC-BINDING_FACTOR | brain | 6.25117 |
| SRF | muscle | 6.23754 |
| NF-Y | eye | 6.16483 |
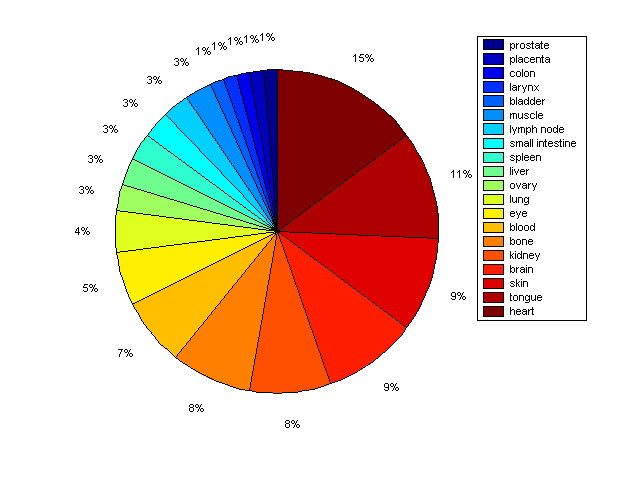
Distribution of Co-regulatory TFs
|
|
|
Description: this pie chart displays the distribution of co-regulatory transcription factors (TFs) in different tissues. Color schema: the tissue with the largest percentage of co-regulatory TFs is colored dark red whereas the tissue with the smallest percentage of co-regulatory TFs is colored dark blue. Tissues with intermediate percentages of co-regulatory TFs are colored from light red to yellow and cyan and then to light blue. |