Summary Table (Download Table)
| Co-regulatory TF | Tissue | -log(P) |
  | | |
| PU.1 | lymph_node | 21.0245 |
| AP-2 | small_intestine | 18.7921 |
| AP-2GAMMA | small_intestine | 17.3843 |
| E2F-4/DP-1 | small_intestine | 16.8687 |
| AP-2ALPHA | small_intestine | 16.6356 |
| PU.1 | blood | 13.0135 |
| NRF-1 | cervix | 12.9641 |
| SP1 | larynx | 12.5907 |
| PEA3 | bone_marrow | 12.5379 |
| SRF | small_intestine | 11.6704 |
| AR | blood | 11.5751 |
| NERF1A | lymph_node | 11.4787 |
| ELF-1 | blood | 11.1466 |
| NF-KAPPAB | lymph_node | 11.1194 |
| E2F-1 | small_intestine | 10.9467 |
| FOXJ2 | blood | 10.7843 |
| C-ETS-1 | lymph_node | 10.731 |
| NRF-1 | bladder | 10.7249 |
| ELK-1 | small_intestine | 10.3653 |
| C-ETS-2 | lymph_node | 10.2164 |
| ETF | larynx | 9.79955 |
| E2F | small_intestine | 9.79841 |
| PEA3 | blood | 9.75145 |
| MYOD | lymph_node | 9.72407 |
| GABP | testis | 9.60029 |
| STAT1 | bone_marrow | 9.09842 |
| OSF2 | bone_marrow | 9.05566 |
| PU.1 | thymus | 9.04906 |
| ZID | small_intestine | 9.01208 |
| WHN | small_intestine | 8.96758 |
| BACH2 | small_intestine | 8.86407 |
| C-MYB | small_intestine | 8.849 |
| E2F | testis | 8.76633 |
| USF2 | small_intestine | 8.62864 |
| OSF2 | blood | 8.60046 |
| E2F-4/DP-1 | testis | 8.60021 |
| NF-Y | small_intestine | 8.52335 |
| USF | small_intestine | 8.29708 |
| STAT3 | bone_marrow | 8.29536 |
| GATA-X | thymus | 8.29126 |
| C/EBPGAMMA | bone_marrow | 8.27889 |
| MIF-1 | testis | 8.24592 |
| RB/E2F-1/DP-1 | testis | 8.19858 |
| GABP | bone_marrow | 8.19777 |
| NRF-1 | testis | 8.17112 |
| GABP | small_intestine | 8.16714 |
| E2F | cervix | 8.14688 |
| RORALPHA2 | bone_marrow | 8.104 |
| GATA-2 | bone_marrow | 8.05995 |
| SMAD-4 | bone_marrow | 8.05007 |
| MEIS1A/HOXA9 | small_intestine | 8.02972 |
| TEL-2 | bone_marrow | 7.99961 |
| ATF6 | small_intestine | 7.98093 |
| C-MYC/MAX | small_intestine | 7.96189 |
| HIF-1 | small_intestine | 7.84131 |
| ELF-1 | lymph_node | 7.66506 |
| LBP-1 | muscle | 7.64049 |
| PEA3 | lymph_node | 7.61755 |
| SREBP-1 | mammary_gland | 7.61299 |
| PU.1 | small_intestine | 7.59524 |
| TEL-2 | blood | 7.56019 |
| C-ETS-2 | bone_marrow | 7.47969 |
| C-ETS-1 | blood | 7.39727 |
| AP-1 | bone_marrow | 7.37036 |
| ARNT | small_intestine | 7.36873 |
| GABP | bladder | 7.33096 |
| ELK-1 | cervix | 7.30764 |
| TFII-I | larynx | 7.2953 |
| NF-KAPPAB | blood | 7.24059 |
| PEA3 | testis | 7.20339 |
| ELK-1 | testis | 7.14576 |
| AREB6 | larynx | 7.14096 |
| C-ETS-1 | thymus | 7.08582 |
| CRE-BP1 | bone_marrow | 7.05187 |
| RORALPHA2 | blood | 7.00212 |
| LEF-1 | colon | 6.98987 |
| NF-Y | cervix | 6.96339 |
| OSF2 | larynx | 6.95793 |
| C-ETS-1 | bone_marrow | 6.94693 |
| EGR-3 | cervix | 6.94111 |
| NERF1A | thymus | 6.90834 |
| STAT1 | blood | 6.81787 |
| PAX-2 | tongue | 6.81045 |
| NF-Y | bone_marrow | 6.7687 |
| ICSBP | lymph_node | 6.75011 |
| POU3F2 | skin | 6.69154 |
| STAT4 | mammary_gland | 6.66273 |
| NERF1A | bone_marrow | 6.65381 |
| NRF-1 | larynx | 6.62024 |
| AP-1 | blood | 6.61462 |
| PEA3 | cervix | 6.56518 |
| E4F1 | bone_marrow | 6.56078 |
| TEL-2 | testis | 6.55101 |
| CREB | bladder | 6.53505 |
| NF-AT | lymph_node | 6.52376 |
| STAT1 | small_intestine | 6.50335 |
| GATA-2 | larynx | 6.48766 |
| E2F-4/DP-1 | cervix | 6.45074 |
| E47 | tongue | 6.44389 |
| MAZ | thymus | 6.41492 |
| PEA3 | larynx | 6.39983 |
| GATA-1 | thymus | 6.39897 |
| NRF-1 | bone_marrow | 6.36879 |
| EGR-3 | larynx | 6.36533 |
| AML-1A | bone_marrow | 6.35391 |
| AML1 | bone_marrow | 6.35391 |
| SMAD-4 | larynx | 6.33644 |
| SREBP-1 | tongue | 6.32279 |
| C-REL | soft_tissue | 6.28456 |
| GABP | tongue | 6.25222 |
| ATF | lung | 6.23284 |
| C-MYB | bone_marrow | 6.19404 |
| LBP-1 | bone_marrow | 6.16337 |
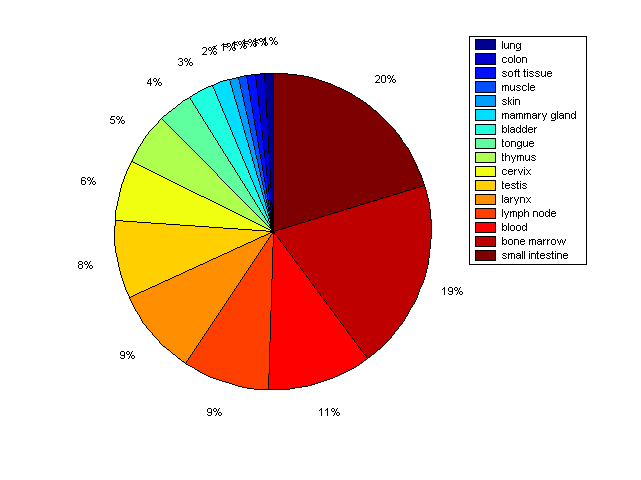
Distribution of Co-regulatory TFs
|
|
|
Description: this pie chart displays the distribution of co-regulatory transcription factors (TFs) in different tissues. Color schema: the tissue with the largest percentage of co-regulatory TFs is colored dark red whereas the tissue with the smallest percentage of co-regulatory TFs is colored dark blue. Tissues with intermediate percentages of co-regulatory TFs are colored from light red to yellow and cyan and then to light blue. |