Summary Table (Download Table)
| Co-regulatory TF | Tissue | -log(P) |
  | | |
| PEA3 | blood | 20.7971 |
| TEL-2 | blood | 15.3055 |
| FOXJ2 | blood | 15.2215 |
| C-ETS-1 | blood | 13.8172 |
| PU.1 | blood | 13.5255 |
| PEA3 | bone_marrow | 12.9596 |
| ICSBP | lymph_node | 12.3659 |
| ELK-1 | blood | 11.1466 |
| FOXJ2 | bone_marrow | 10.2304 |
| TITF1 | small_intestine | 10.0268 |
| AP-1 | blood | 9.31453 |
| OCT-1 | small_intestine | 9.22416 |
| PU.1 | bone_marrow | 9.11404 |
| NF-KAPPAB | lymph_node | 9.09063 |
| LHX3 | prostate | 8.96977 |
| E47 | pancreas | 8.83313 |
| AP-1 | tongue | 8.58598 |
| AP-1 | lymph_node | 8.49326 |
| NF-E2 | blood | 8.45816 |
| C-ETS-2 | blood | 8.45413 |
| BACH1 | lymph_node | 8.35805 |
| TATA | bone_marrow | 8.34718 |
| IRF-1 | lymph_node | 8.32845 |
| IRF1 | soft_tissue | 8.31566 |
| C/EBPDELTA | blood | 8.21882 |
| GATA-6 | bone_marrow | 8.21567 |
| ELF-1 | lymph_node | 8.16074 |
| NF-E2 | tongue | 8.07332 |
| BACH2 | tongue | 8.06111 |
| OCT-1 | lymph_node | 7.92613 |
| ELF-1 | blood | 7.83767 |
| FOXJ2 | bone | 7.8306 |
| C/EBPDELTA | soft_tissue | 7.76779 |
| ELK-1 | lymph_node | 7.66506 |
| SRF | small_intestine | 7.4698 |
| CHOP-C/EBPALPHA | blood | 7.43518 |
| C-ETS-1 | spleen | 7.31072 |
| STAT1 | colon | 7.27781 |
| NKX3A | bone_marrow | 7.09605 |
| HNF-1 | colon | 6.81461 |
| EF-C | bone | 6.75079 |
| SF-1 | soft_tissue | 6.61756 |
| POU1F1 | bone | 6.45211 |
| TEL-2 | bone_marrow | 6.44436 |
| AP-3 | bone | 6.44432 |
| AML-1A | colon | 6.37349 |
| AML1 | colon | 6.37349 |
| NF-Y | blood | 6.31069 |
| CDP | blood | 6.29595 |
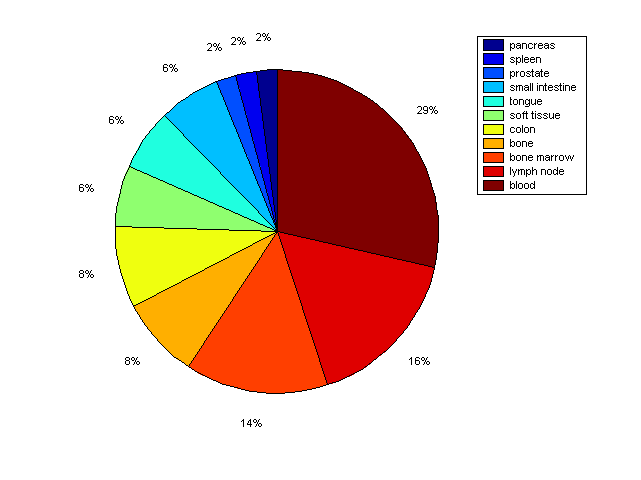
Distribution of Co-regulatory TFs
|
|
|
Description: this pie chart displays the distribution of co-regulatory transcription factors (TFs) in different tissues. Color schema: the tissue with the largest percentage of co-regulatory TFs is colored dark red whereas the tissue with the smallest percentage of co-regulatory TFs is colored dark blue. Tissues with intermediate percentages of co-regulatory TFs are colored from light red to yellow and cyan and then to light blue. |