Summary Table (Download Table)
| Co-regulatory TF | Tissue | -log(P) |
  | | |
| HNF-1 | liver | 10.2304 |
| C/EBP | brain | 8.93107 |
| HNF-1 | peripheral_nervous_system | 8.48099 |
| WHN | small_intestine | 8.33427 |
| GCNF | kidney | 8.19631 |
| SF-1 | soft_tissue | 8.00786 |
| C/EBPALPHA | brain | 7.68849 |
| MEF-2 | brain | 7.60522 |
| CHX10 | brain | 7.56039 |
| SRF | kidney | 7.46519 |
| LMO2_COMPLEX | kidney | 7.35995 |
| OCT-X | heart | 7.20282 |
| TCF-4 | bladder | 7.18251 |
| OCT-1 | testis | 6.82177 |
| OSF2 | kidney | 6.78484 |
| SRF | peripheral_nervous_system | 6.78121 |
| SREBP-1 | peripheral_nervous_system | 6.76888 |
| FOXO4 | liver | 6.76245 |
| LHX3 | placenta | 6.53623 |
| TBP | soft_tissue | 6.5078 |
| AML-1A | muscle | 6.3706 |
| AML1 | muscle | 6.3706 |
| HSF2 | brain | 6.27327 |
| CDP_CR3 | testis | 6.24402 |
| FXR | heart | 6.20791 |
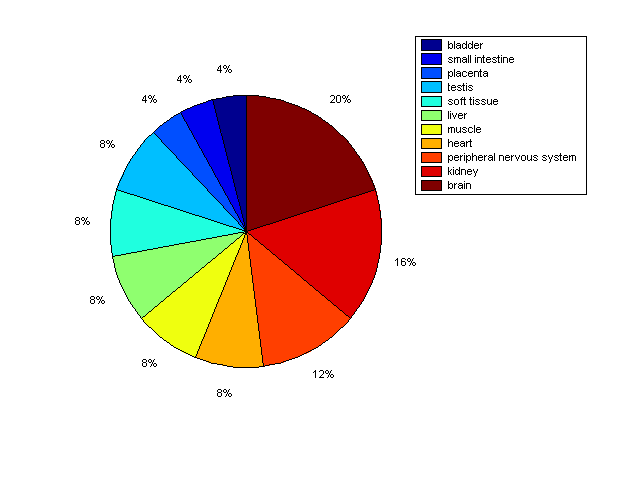
Distribution of Co-regulatory TFs
|
|
|
Description: this pie chart displays the distribution of co-regulatory transcription factors (TFs) in different tissues. Color schema: the tissue with the largest percentage of co-regulatory TFs is colored dark red whereas the tissue with the smallest percentage of co-regulatory TFs is colored dark blue. Tissues with intermediate percentages of co-regulatory TFs are colored from light red to yellow and cyan and then to light blue. |