Summary Table (Download Table)
| Co-regulatory TF | Tissue | -log(P) |
  | | |
| HNF-1 | liver | 20.905 |
| LHX3 | small_intestine | 20.8459 |
| SRY | small_intestine | 14.3419 |
| SRY | peripheral_nervous_system | 12.1497 |
| MEF-2 | brain | 11.4472 |
| TST-1 | brain | 11.2774 |
| C/EBPBETA | brain | 11.2019 |
| SOX-9 | brain | 11.1889 |
| TBP | small_intestine | 11.1328 |
| AP-2ALPHA | mammary_gland | 10.6724 |
| TEF | brain | 10.4987 |
| SRF | heart | 10.0079 |
| HNF-1 | peripheral_nervous_system | 9.83362 |
| WHN | small_intestine | 9.71042 |
| FREAC-3 | brain | 9.70194 |
| TEF-1 | soft_tissue | 9.68905 |
| ICSBP | soft_tissue | 9.4818 |
| LHX3 | brain | 9.35556 |
| GATA-1 | peripheral_nervous_system | 9.08456 |
| NKX2-2 | brain | 9.02622 |
| GCNF | peripheral_nervous_system | 8.88485 |
| CART-1 | small_intestine | 8.88276 |
| E47 | mammary_gland | 8.88208 |
| MRF-2 | brain | 8.82598 |
| FREAC-3 | small_intestine | 8.76144 |
| TATA | small_intestine | 8.73437 |
| NR2E3 | small_intestine | 8.72678 |
| C/EBPALPHA | brain | 8.67948 |
| ICSBP | brain | 8.67695 |
| HFH-3 | small_intestine | 8.65868 |
| C/EBP | brain | 8.64805 |
| LBP-1 | mammary_gland | 8.48201 |
| CHOP-C/EBPALPHA | peripheral_nervous_system | 8.35685 |
| POU1F1 | peripheral_nervous_system | 8.24517 |
| COUP-TF/HNF-4 | liver | 8.21273 |
| OCT-1 | small_intestine | 8.04401 |
| TST-1 | heart | 7.96951 |
| MAZR | peripheral_nervous_system | 7.9148 |
| OCT-1 | liver | 7.90538 |
| POU1F1 | bone | 7.87314 |
| MAZR | small_intestine | 7.86141 |
| PBX-1 | small_intestine | 7.77263 |
| HNF-4ALPHA | liver | 7.76942 |
| TCF-4 | small_intestine | 7.73432 |
| TATA | liver | 7.67737 |
| MIF-1 | small_intestine | 7.65103 |
| FXR | heart | 7.61186 |
| FXR | soft_tissue | 7.56108 |
| POU3F2 | brain | 7.55527 |
| OCT-1 | heart | 7.53013 |
| CREB | mammary_gland | 7.47709 |
| HLF | brain | 7.47208 |
| ATF | mammary_gland | 7.42519 |
| FOXD3 | small_intestine | 7.37293 |
| FREAC-4 | eye | 7.34727 |
| FAC1 | peripheral_nervous_system | 7.31623 |
| FOXO1 | liver | 7.30623 |
| PBX-1 | brain | 7.29243 |
| OCT-1 | brain | 7.2591 |
| TCF11/MAFG | heart | 7.22741 |
| E4BP4 | brain | 7.16329 |
| ERR_ALPHA | brain | 7.0463 |
| TCF-4 | pancreas | 6.99191 |
| POU3F2 | eye | 6.93376 |
| COUP-TF/HNF-4 | small_intestine | 6.91845 |
| RP58 | peripheral_nervous_system | 6.85934 |
| HFH-4 | small_intestine | 6.81384 |
| STAT1 | mammary_gland | 6.81168 |
| CACCC-BINDING_FACTOR | peripheral_nervous_system | 6.75245 |
| FOXJ2 | small_intestine | 6.72381 |
| NKX3A | small_intestine | 6.7038 |
| C/EBPGAMMA | soft_tissue | 6.60831 |
| CDP | liver | 6.57739 |
| CDP | colon | 6.55167 |
| SRF | liver | 6.52607 |
| OCT-X | brain | 6.5235 |
| FOXO3 | placenta | 6.52032 |
| C/EBP | small_intestine | 6.44528 |
| TAX/CREB | soft_tissue | 6.44056 |
| FOXO4 | small_intestine | 6.37676 |
| GCNF | brain | 6.35093 |
| SMAD-4 | mammary_gland | 6.33742 |
| GATA-X | brain | 6.33481 |
| PBX1B | pancreas | 6.30457 |
| HFH-4 | mammary_gland | 6.28684 |
| CRX | liver | 6.2135 |
| FOXD3 | liver | 6.20028 |
| HNF-1 | small_intestine | 6.19154 |
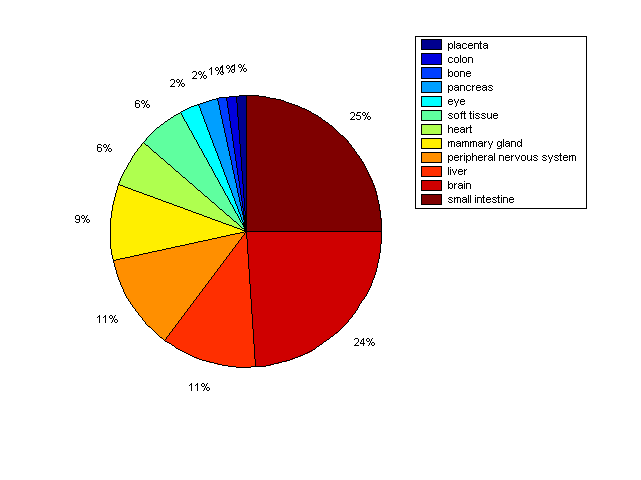
Distribution of Co-regulatory TFs
|
|
|
Description: this pie chart displays the distribution of co-regulatory transcription factors (TFs) in different tissues. Color schema: the tissue with the largest percentage of co-regulatory TFs is colored dark red whereas the tissue with the smallest percentage of co-regulatory TFs is colored dark blue. Tissues with intermediate percentages of co-regulatory TFs are colored from light red to yellow and cyan and then to light blue. |