Summary Table (Download Table)
| Co-regulatory TF | Tissue | -log(P) |
  | | |
| AFP1 | colon | 9.40307 |
| AFP1 | placenta | 11.3306 |
| AHR/ARNT | muscle | 7.04704 |
| ALPHA-CP1 | brain | 8.03295 |
| ALPHA-CP1 | small_intestine | 8.42242 |
| ALX-4 | colon | 8.97044 |
| AMEF-2 | soft_tissue | 6.34535 |
| AP-1 | heart | 15.787 |
| AP-1 | muscle | 15.6531 |
| AP-1 | tongue | 6.46736 |
| AP-2 | thymus | 7.73464 |
| AP-2GAMMA | muscle | 6.73053 |
| AP-4 | muscle | 9.07937 |
| AR | heart | 10.1295 |
| AREB6 | muscle | 11.3895 |
| ARP-1 | heart | 8.12382 |
| ARP-1 | muscle | 10.7245 |
| ARP-1 | small_intestine | 6.38451 |
| ATF | peripheral_nervous_system | 6.24854 |
| ATF | placenta | 13.6564 |
| ATF | tongue | 8.68195 |
| ATF-1 | placenta | 8.21286 |
| ATF6 | muscle | 6.61982 |
| BACH1 | tongue | 6.23985 |
| BRN-2 | brain | 7.66024 |
| BRN-2 | eye | 8.39371 |
| C-MYB | muscle | 7.70407 |
| C-REL | muscle | 8.13481 |
| C/EBPALPHA | heart | 9.3534 |
| C/EBPALPHA | small_intestine | 7.95031 |
| C/EBPBETA | heart | 9.5415 |
| C/EBPBETA | larynx | 7.65802 |
| C/EBPBETA | muscle | 12.1428 |
| C/EBPBETA | placenta | 6.38015 |
| C/EBPBETA | soft_tissue | 6.85457 |
| C/EBPGAMMA | lung | 8.20189 |
| C/EBPGAMMA | soft_tissue | 8.44017 |
| CDC5 | kidney | 7.73381 |
| CDP | colon | 12.177 |
| CDP | mammary_gland | 7.88807 |
| CDP_CR3+HD | muscle | 8.63138 |
| CHOP-C/EBPALPHA | small_intestine | 8.38785 |
| CHX10 | placenta | 8.58741 |
| COUP-TF/HNF-4 | liver | 8.83228 |
| CRE-BP1 | placenta | 7.51868 |
| CRE-BP1/C-JUN | placenta | 6.68809 |
| CREB | peripheral_nervous_system | 9.78474 |
| CREB | placenta | 7.92442 |
| CREB | soft_tissue | 6.80668 |
| CRX | small_intestine | 9.40666 |
| E12 | peripheral_nervous_system | 9.63617 |
| E2F | small_intestine | 6.77628 |
| E2F-1/DP-1 | bone_marrow | 6.42456 |
| E2F-4/DP-1 | small_intestine | 6.93781 |
| E2F-4/DP-2 | bone_marrow | 6.64088 |
| E47 | larynx | 7.41989 |
| E47 | small_intestine | 8.2337 |
| EF-C | muscle | 8.77324 |
| ELF-1 | bone_marrow | 8.34718 |
| ER | muscle | 8.83733 |
| ER | placenta | 14.3499 |
| ERR_ALPHA | small_intestine | 6.99812 |
| FAC1 | pancreas | 6.39131 |
| FOXD3 | small_intestine | 11.5631 |
| FOXJ2 | small_intestine | 7.37724 |
| FOXO1 | muscle | 6.19003 |
| FOXO1 | soft_tissue | 12.2713 |
| FOXO3 | small_intestine | 7.13332 |
| FOXO3 | soft_tissue | 7.44562 |
| FOXO4 | soft_tissue | 11.711 |
| FREAC-3 | small_intestine | 8.67077 |
| FREAC-7 | kidney | 9.88422 |
| GATA-4 | stomach | 6.47079 |
| GATA-6 | heart | 6.42173 |
| GCNF | colon | 8.51396 |
| GCNF | kidney | 7.99606 |
| GCNF | small_intestine | 7.29105 |
| GR | heart | 13.3012 |
| HAND1/E47 | soft_tissue | 6.71411 |
| HFH-3 | small_intestine | 7.98763 |
| HFH-4 | small_intestine | 9.98013 |
| HIF-1 | bone | 9.83883 |
| HMG_IY | kidney | 6.47588 |
| HNF-1 | kidney | 11.6623 |
| HNF-1 | liver | 10.5542 |
| HNF-1 | small_intestine | 11.8121 |
| HNF-1 | spleen | 8.06925 |
| HNF-3ALPHA | liver | 7.67737 |
| HNF-3ALPHA | small_intestine | 8.73437 |
| HNF-4ALPHA | colon | 7.05473 |
| HNF-4ALPHA | muscle | 8.58247 |
| HOXA4 | muscle | 6.58641 |
| HSF1 | heart | 7.86086 |
| LBP-1 | larynx | 7.43226 |
| LBP-1 | muscle | 11.0243 |
| LEF-1 | colon | 6.53629 |
| LF-A1 | bone | 6.68996 |
| LF-A1 | placenta | 6.43122 |
| LHX3 | kidney | 7.57584 |
| LHX3 | placenta | 8.23349 |
| LHX3 | skin | 7.57306 |
| LMO2_COMPLEX | heart | 6.58705 |
| LXR | muscle | 7.2788 |
| MEF-2 | colon | 8.50915 |
| MEF-2 | heart | 18.8427 |
| MEF-2 | muscle | 41.1865 |
| MEIS1B/HOXA9 | colon | 9.08517 |
| MEIS1B/HOXA9 | muscle | 6.62768 |
| MEIS1B/HOXA9 | small_intestine | 6.57507 |
| MYOD | peripheral_nervous_system | 10.286 |
| MZF1 | lung | 6.86731 |
| NCX | bone | 6.24491 |
| NERF1A | larynx | 6.21489 |
| NF-AT | peripheral_nervous_system | 10.1655 |
| NF-E2 | eye | 6.97633 |
| NF-E2 | liver | 7.59416 |
| NF-KAPPAB | muscle | 8.4131 |
| NF-KAPPAB | spleen | 6.76866 |
| NF-KAPPAB_(P50) | heart | 6.42446 |
| NF-KAPPAB_(P65) | larynx | 6.52181 |
| NF-KAPPAB_(P65) | muscle | 8.76845 |
| NF-Y | brain | 7.44902 |
| NF-Y | small_intestine | 8.34098 |
| NKX2-2 | ovary | 7.41174 |
| NKX3A | small_intestine | 12.6524 |
| NKX6-1 | colon | 7.22488 |
| OCT-1 | colon | 7.76855 |
| OCT-1 | eye | 7.89242 |
| OCT-1 | heart | 9.89785 |
| OCT-1 | muscle | 7.74755 |
| OCT-1 | pancreas | 7.11246 |
| OCT-1 | small_intestine | 8.13561 |
| P53 | muscle | 10.3793 |
| PAX-1 | muscle | 7.97763 |
| PAX-2 | small_intestine | 6.31879 |
| PAX-6 | kidney | 8.86963 |
| POU3F2 | heart | 10.3821 |
| POU3F2 | kidney | 8.03505 |
| POU3F2 | placenta | 7.2106 |
| PPARG | heart | 6.42491 |
| PU.1 | muscle | 7.08332 |
| RFX1 | heart | 11.071 |
| RFX1 | muscle | 6.26142 |
| RFX1 | pancreas | 8.47774 |
| RFX1 | small_intestine | 7.277 |
| RORALPHA2 | muscle | 6.45333 |
| RREB-1 | bone | 10.9943 |
| RREB-1 | heart | 8.97671 |
| RREB-1 | muscle | 7.29376 |
| RREB-1 | small_intestine | 9.03342 |
| RSRFC4 | bone | 11.735 |
| RSRFC4 | brain | 6.26958 |
| RSRFC4 | colon | 6.90518 |
| RSRFC4 | muscle | 20.3019 |
| SF-1 | muscle | 7.89183 |
| SF-1 | soft_tissue | 7.8278 |
| SMAD-4 | muscle | 6.66119 |
| SMAD-4 | skin | 7.32522 |
| SP1 | bone | 7.59794 |
| SREBP-1 | brain | 7.94726 |
| SREBP-1 | muscle | 7.42458 |
| SREBP-1 | peripheral_nervous_system | 6.43325 |
| SRF | larynx | 11.6752 |
| SRF | muscle | 29.8598 |
| SRY | colon | 7.18279 |
| SRY | small_intestine | 11.1591 |
| SRY | soft_tissue | 6.99072 |
| STAT5A | lung | 6.75757 |
| STAT5B_(HOMODIMER) | heart | 8.87776 |
| STAT6 | lung | 7.06488 |
| TAL-1ALPHA/E47 | muscle | 8.38446 |
| TAL-1BETA/E47 | heart | 8.26291 |
| TAL-1BETA/E47 | muscle | 6.60705 |
| TAL-1BETA/ITF-2 | muscle | 7.5491 |
| TATA | bone | 6.28209 |
| TATA | larynx | 6.35441 |
| TATA | muscle | 8.36981 |
| TAX/CREB | bone | 7.349 |
| TBP | bone | 10.4502 |
| TBP | colon | 7.00114 |
| TBP | muscle | 10.0178 |
| TBP | small_intestine | 7.0556 |
| TBP | soft_tissue | 11.9252 |
| TCF-4 | colon | 7.38214 |
| TCF-4 | pancreas | 7.092 |
| TCF11/MAFG | liver | 6.31981 |
| TEF | eye | 9.0393 |
| TEF | peripheral_nervous_system | 6.68602 |
| TEF-1 | bone | 16.7502 |
| TEF-1 | larynx | 6.90445 |
| TEF-1 | muscle | 9.53373 |
| TFII-I | muscle | 8.11832 |
| TFIIA | brain | 12.7449 |
| TGIF | heart | 7.04141 |
| TGIF | peripheral_nervous_system | 6.44499 |
| TITF1 | eye | 6.82769 |
| TITF1 | placenta | 9.23261 |
| TITF1 | small_intestine | 13.6712 |
| TST-1 | muscle | 10.5714 |
| USF2 | pancreas | 6.52031 |
| VDR | brain | 8.75638 |
| VDR | lung | 6.81152 |
| ZID | muscle | 9.6263 |
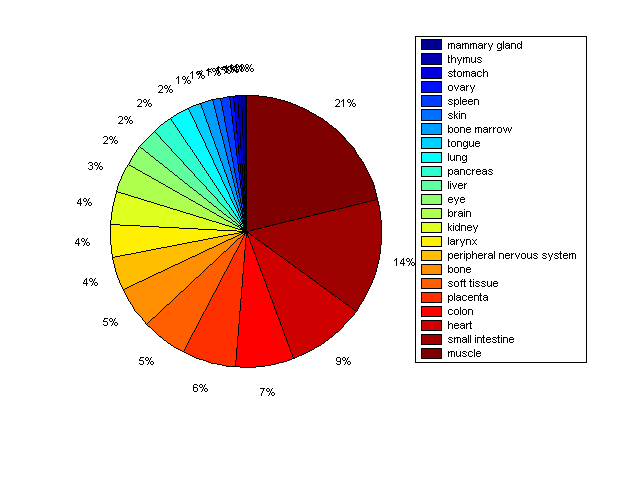
Distribution of Co-regulatory TFs
|
|
|
Description: this pie chart displays the distribution of co-regulatory transcription factors (TFs) in different tissues. Color schema: the tissue with the largest percentage of co-regulatory TFs is colored dark red whereas the tissue with the smallest percentage of co-regulatory TFs is colored dark blue. Tissues with intermediate percentages of co-regulatory TFs are colored from light red to yellow and cyan and then to light blue. |