Summary Table (Download Table)
| Co-regulatory TF | Tissue | -log(P) |
  | | |
| HNF-1 | colon | 11.6088 |
| NF-Y | bladder | 10.2256 |
| CDP_CR1 | ovary | 8.98987 |
| PAX-8 | brain | 8.61283 |
| SREBP-1 | bone_marrow | 8.38332 |
| C/EBPGAMMA | testis | 8.01441 |
| PAX-6 | brain | 7.77416 |
| TCF-4 | colon | 7.66138 |
| ATF-1 | pancreas | 7.57507 |
| FREAC-3 | colon | 7.55236 |
| PAX-1 | testis | 7.12855 |
| C-ETS-1 | bone_marrow | 7.02582 |
| STAT1 | bone_marrow | 6.96163 |
| RFX1 | testis | 6.87723 |
| CACCC-BINDING_FACTOR | ovary | 6.79283 |
| CRE-BP1 | kidney | 6.60441 |
| TITF1 | kidney | 6.35701 |
| IPF1 | tongue | 6.34358 |
| CDP_CR3 | brain | 6.27275 |
| TATA | bone | 6.24491 |
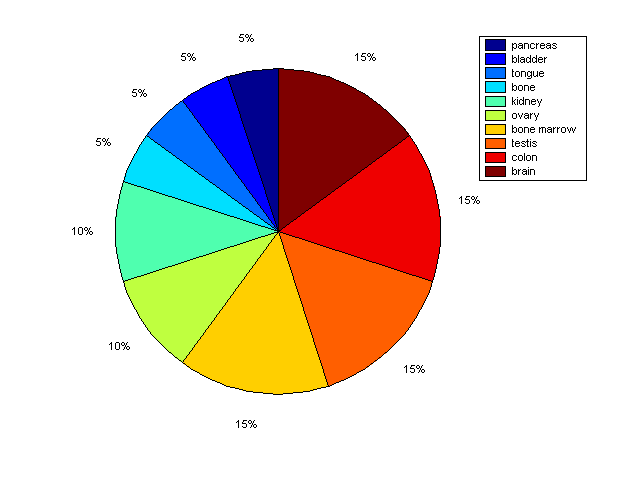
Distribution of Co-regulatory TFs
|
|
|
Description: this pie chart displays the distribution of co-regulatory transcription factors (TFs) in different tissues. Color schema: the tissue with the largest percentage of co-regulatory TFs is colored dark red whereas the tissue with the smallest percentage of co-regulatory TFs is colored dark blue. Tissues with intermediate percentages of co-regulatory TFs are colored from light red to yellow and cyan and then to light blue. |