Summary Table (Download Table)
| Co-regulatory TF | Tissue | -log(P) |
  | | |
| LXR | ovary | 15.0086 |
| AP-2ALPHA | ovary | 14.6823 |
| CREB | brain | 14.3873 |
| NF-Y | brain | 13.0735 |
| DBP | ovary | 12.3434 |
| DBP | peripheral_nervous_system | 12.2449 |
| AREB6 | skin | 11.777 |
| SREBP-1 | brain | 10.8884 |
| ATF | brain | 10.6904 |
| NRSF | brain | 10.2812 |
| CRE-BP1/C-JUN | brain | 9.90592 |
| ATF | placenta | 9.69743 |
| ETF | tongue | 9.04619 |
| ATF-1 | placenta | 8.94541 |
| CREB | ovary | 8.77257 |
| TATA | brain | 8.75638 |
| TAL-1BETA/E47 | skin | 8.57002 |
| MIF-1 | skin | 8.45054 |
| NF-KAPPAB_(P65) | skin | 8.33236 |
| RFX1 | brain | 8.12238 |
| LMO2_COMPLEX | skin | 8.09632 |
| LBP-1 | skin | 8.03881 |
| E2F | small_intestine | 7.89615 |
| TAL-1ALPHA/E47 | muscle | 7.76855 |
| MTF-1 | brain | 7.72936 |
| AP-1 | spleen | 7.71787 |
| CACCC-BINDING_FACTOR | skin | 7.5409 |
| TFII-I | brain | 7.47374 |
| C-ETS-1 | skin | 7.45539 |
| E2F | ovary | 7.42501 |
| E2F-1 | small_intestine | 7.33874 |
| CRE-BP1 | brain | 7.16589 |
| AREB6 | peripheral_nervous_system | 7.08224 |
| TFIIA | skin | 7.01529 |
| TATA | lung | 6.81152 |
| TAL-1BETA/E47 | muscle | 6.77126 |
| E2F-4/DP-1 | small_intestine | 6.75683 |
| AP-1 | larynx | 6.72746 |
| NRSF | ovary | 6.71676 |
| PPARALPHA/RXR-ALPHA | larynx | 6.62128 |
| POU3F2 | heart | 6.57727 |
| NF-MUE1 | ovary | 6.5387 |
| C/EBP | brain | 6.52698 |
| NF-KAPPAB_(P65) | spleen | 6.41805 |
| AP-4 | muscle | 6.41037 |
| RB/E2F-1/DP-1 | small_intestine | 6.37313 |
| CREB | peripheral_nervous_system | 6.28438 |
| RFX1 | skin | 6.24298 |
| ZIC2 | skin | 6.23197 |
| MTF-1 | placenta | 6.20898 |
| TAL-1ALPHA/E47 | skin | 6.18628 |
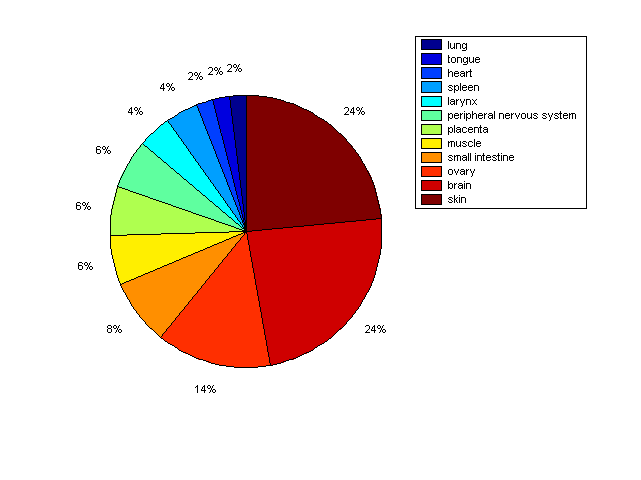
Distribution of Co-regulatory TFs
|
|
|
Description: this pie chart displays the distribution of co-regulatory transcription factors (TFs) in different tissues. Color schema: the tissue with the largest percentage of co-regulatory TFs is colored dark red whereas the tissue with the smallest percentage of co-regulatory TFs is colored dark blue. Tissues with intermediate percentages of co-regulatory TFs are colored from light red to yellow and cyan and then to light blue. |