Summary Table (Download Table)
| Co-regulatory TF | Tissue | -log(P) |
  | | |
| PAX-8 | larynx | 10.8743 |
| TCF11/MAFG | heart | 10.6661 |
| FREAC-3 | brain | 9.57076 |
| USF | muscle | 9.34376 |
| HNF-1 | liver | 8.7386 |
| C/EBPBETA | muscle | 8.37695 |
| NF-AT | soft_tissue | 8.13963 |
| NF-1 | lung | 7.38936 |
| MEF-2 | larynx | 7.26625 |
| AREB6 | larynx | 7.22604 |
| SREBP-1 | muscle | 7.14551 |
| CHX10 | small_intestine | 7.11336 |
| PPARG | soft_tissue | 6.83392 |
| MZF1 | ovary | 6.72627 |
| TATA | muscle | 6.58641 |
| GATA-4 | small_intestine | 6.51592 |
| CHX10 | muscle | 6.44121 |
| PITX2 | soft_tissue | 6.3956 |
| TEF-1 | larynx | 6.38842 |
| TCF-4 | soft_tissue | 6.35063 |
| CHX10 | heart | 6.32075 |
| NKX6-2 | uterus | 6.24828 |
| RFX1 | muscle | 6.24258 |
| LBP-1 | larynx | 6.17775 |
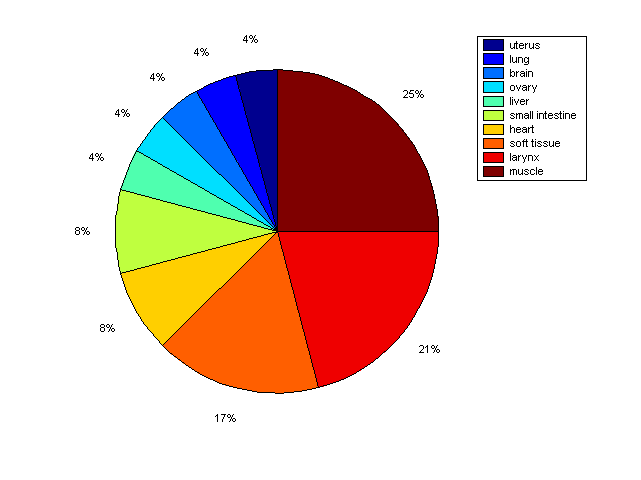
Distribution of Co-regulatory TFs
|
|
|
Description: this pie chart displays the distribution of co-regulatory transcription factors (TFs) in different tissues. Color schema: the tissue with the largest percentage of co-regulatory TFs is colored dark red whereas the tissue with the smallest percentage of co-regulatory TFs is colored dark blue. Tissues with intermediate percentages of co-regulatory TFs are colored from light red to yellow and cyan and then to light blue. |