Summary Table (Download Table)
| Co-regulatory TF | Tissue | -log(P) |
  | | |
| SREBP-1 | bladder | 43.1855 |
| MAX | bladder | 22.6349 |
| USF | bladder | 21.6869 |
| ARNT | bladder | 21.6458 |
| C-MYC/MAX | bladder | 19.5614 |
| USF | tongue | 14.8951 |
| HIF-1 | tongue | 14.825 |
| LBP-1 | muscle | 14.3127 |
| SREBP-1 | bone_marrow | 12.8258 |
| USF | muscle | 11.8742 |
| GABP | small_intestine | 11.8711 |
| SREBP-1 | muscle | 11.7196 |
| C-MYC/MAX | tongue | 11.6331 |
| PAX-8 | bladder | 11.3331 |
| USF2 | bladder | 10.9181 |
| SREBP-1 | small_intestine | 10.4574 |
| XBP-1 | bladder | 10.4096 |
| ARNT | tongue | 9.57654 |
| USF | bone_marrow | 9.51574 |
| ARNT | muscle | 9.06507 |
| MIF-1 | muscle | 8.78042 |
| C-MYC/MAX | bone_marrow | 8.63514 |
| ELK-1 | small_intestine | 8.62864 |
| MAX | bone_marrow | 8.42732 |
| NRF-1 | cervix | 8.26026 |
| PAX-2 | bladder | 8.1376 |
| MAX | muscle | 7.89925 |
| SREBP-1 | tongue | 7.78133 |
| RFX1 | muscle | 7.74121 |
| POU1F1 | muscle | 7.62366 |
| ZID | small_intestine | 7.50291 |
| USF2 | tongue | 7.49505 |
| C-MYC/MAX | muscle | 7.24137 |
| MEF-2 | pancreas | 7.1045 |
| NRF-1 | testis | 7.10353 |
| LEF-1 | pancreas | 7.08798 |
| SP1 | testis | 7.0232 |
| PEA3 | small_intestine | 6.88423 |
| AP-4 | muscle | 6.85558 |
| MEF-2 | muscle | 6.82436 |
| ER | bone_marrow | 6.67624 |
| POU3F2 | muscle | 6.67077 |
| NRF-1 | pancreas | 6.64535 |
| NRF-1 | tongue | 6.58012 |
| IPF1 | muscle | 6.579 |
| ARNT | bone_marrow | 6.53733 |
| NRF-1 | small_intestine | 6.52656 |
| TATA | pancreas | 6.52031 |
| ATF6 | bone | 6.35047 |
| CHX10 | brain | 6.34212 |
| E2F | tongue | 6.3182 |
| NRF-1 | skin | 6.29576 |
| RSRFC4 | muscle | 6.2844 |
| LF-A1 | cervix | 6.26666 |
| MEIS1B/HOXA9 | larynx | 6.23091 |
| CREB | larynx | 6.21744 |
| C-MYC/MAX | bone | 6.1876 |
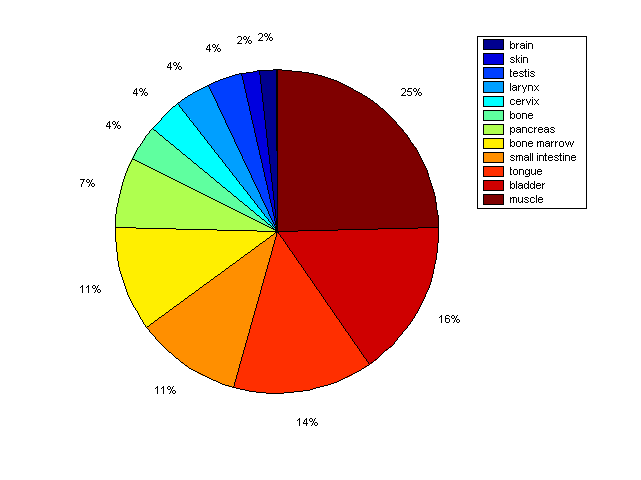
Distribution of Co-regulatory TFs
|
|
|
Description: this pie chart displays the distribution of co-regulatory transcription factors (TFs) in different tissues. Color schema: the tissue with the largest percentage of co-regulatory TFs is colored dark red whereas the tissue with the smallest percentage of co-regulatory TFs is colored dark blue. Tissues with intermediate percentages of co-regulatory TFs are colored from light red to yellow and cyan and then to light blue. |